Introduction
Canada’s charities and voluntary organizations number an estimated 161,000 groups1 (Hall, de Wit, Lasby, McIver, Evers, Johnston, McAuley, Scott, Cucumel, Jolin, Nicol, Berdahl, Roach, Davies, Rowe, Frankel, Brock, & Murray, 2005) in 2003 and the contribution of core nonprofit institutions was valued at $35.6 billion or 2.5% of Gross Domestic Product (GDP) in 2007 (Haggar-Guenette, Hamdad, Laronde-Jones, Pan, & Yu, 2009). This value increased to $100.7 billion or 7.0% of GDP (Haggar-Guenette et al., 2009) when hospitals, universities, and colleges were included with the core non-profit institutions. Given the size and economic scope of the sector, it seems surprising that these figures are, respectively, nine and five years out of date. Yet, in so many ways, it is reflective of the state of our understanding about Canada’s nonprofit sector and the way in which governments, and Canadians, view it.
Over 30 years ago, charitable and nonprofit organizations, governments, and researchers started work to better understand and situate the voluntary sector. Traditionally, groups in the sector would begin any public statement with a recap of the civic and charitable contributions that these organizations brought to the table. The purpose was to say, “We do good works and for that we should get support.”
As economies changed and governments went from expansion to contraction, leaders in the sector began to think that they needed to present an economic argument. They knew that the sector counted thousands of organizations, that it made a large economic contribution, and that it involved millions of Canadians through donations and volunteering, but there were few numbers to prove that. In order to fill this information gap and in the hopes of shifting perceptions, sector groups, researchers, and governments worked together to gather the numbers that other parts of the economy presented on a regular basis. The belief was that these figures would make visible the sector’s worth and that the sector would consequently garner more support from funding organizations, governments, and the Canadian public. The premise of this article is that while solid economic information was created by this research, these efforts did not yield the expected results. The sector was given its time in the sun with the Voluntary Sector Initiative,2 but, apart from tax measures to increase donations to charities, all of this work reaped little in the way of concrete external results.
And the sector still cannot answer some fundamental questions: How many organizations are in the sector? How are they faring given the economy and changes to support from governments? What are the flows of organizations in and out of the sector?
With the exception of the 2005 National Survey of Nonprofit and Voluntary Organizations (NSNVO) (Hall et al., 2005), which provided a snapshot in time, no research has to date authoritatively shown the size and number of the voluntary sector organizations in Canada. It took over 20 years of research and effort to construct the framework that led to the NSNVO. At the time it was conducted, the survey was groundbreaking—it was the most extensive survey of voluntary sector organizations in the world. Canada was a leader in research on the nonprofit sector. The same cannot be said now.
The state of sector research has suffered. The sector can still tweak its volunteering and giving strategies, but sector leaders are at a loss to accurately describe how the sector is affected by changes to the economy and funding. There are few sources of information that show the ebbs and flows of organizations in the sector.
This article reviews the history of research and efforts to find out more about the size, scope, and nature of the voluntary sector. It then looks at the current situation in regard to federal support to sector organizations and why new research is needed in order to monitor changes to the sector. The article concludes by proposing a modest research agenda to inform the sector of these changes and to help it better understand how changes to funding affect the financial health of its organizations and the number of organizations in existence. How can the sector know where it is going if it doesn’t know where it has been?
Data sources on the major components of the voluntary sector
In order to discuss research on the size, scope, and nature of the voluntary sector, one has to confront the basic challenge brought about by the sector’s composition. The sector is composed of three major parts: charities, incorporated nonprofit organizations, and unincorporated nonprofit organizations—there is limited information on each of these components.
If a nonprofit organization is (or has ever been) a registered charity, then it is part of the Canada Revenue Agency’s (CRA’s) charities database. As part of its charitable responsibilities, each charity must file a t3010, annual information return. Since 2000, information from these returns has been put in the CRA’s charities database. The database contains a relative wealth of information on organizations including year of registration (or deregistration) and financial information on assets, liabilities, revenues, and expenditures.
Describing itself as the “official newspaper of the Government of Canada” (The Canada Gazette Directorate, 2012), the Canada Gazette provides some information on nonprofits, both charities and incorporated non-charitable nonprofit organizations. It provides information on mergers and amalgamations of charities. It also reports on deregistered charities, and cites the cause of deregistration (i.e., whether it be voluntary, for failure to file the T3010 for cause, or an annulment).3 The Gazette also provides limited information on the activities of nonprofits such as name changes or surrenders of charter, but this information applies to all corporations including for-profits.
In addition to research on the T3010, there have been a number of studies on charitable donations through questionnaires, surveys, or through use of information from the T1 personal income tax return (research that traces the donation patterns of individual donors).
For those groups that choose to incorporate, they register at the provincial, territorial, or federal level under the relevant Societies Acts or Corporations Acts. There is just very basic information tombstone data available on groups incorporated under the Canada Corporations Act. At the provincial level, in Ontario for example, the database is not available for public viewing. People can follow up with the Office of the Public Guardian and Trustee to inquire about individual nonprofit organizations, but cannot query about the whole set of organizations.
There is a 3-year record of “monthly transactions” on the Canada Corporations website.4
This shows 25 different categories of certificates, notices, and other transactions, but each item provides only very basic information. For example, the website showed that the Canadian Policy Research Networks officially surrendered its charter on October 28, 2011, and gave the group’s file number. An individual could submit a written request for more information using the file number, but this is not an effective way to monitor changes to voluntary sector groups. In addition, this database includes for-profit corporations. Unless the name of the group is somewhat familiar, researchers are not given any indication of whether the groups listed are for-profit or nonprofit.
The CRA currently administers the requirement that certain nonprofit organizations must fill out the Non-Profit Organization (NPO) Information Return (T1044). Nonprofits must fill out the return if they: have interest, dividend, and other investment income in excess of $10,000 in the year; or had total assets in excess of $200,000 in the prior year; or had to file a NPO return the previous fiscal year. The form asks questions about amounts received by the group, its assets and liabilities, remuneration, and its activities. This is not a publicly available database.
There was at least one compilation of the T1044 data conducted by the CRA. In 1993, the 4,956 non-charitable nonprofits that filled out T1044s had assets of just over $14 billion or an average of $2.8 million per organization.5 According to sources within the CRA, there is no similar roll-up of recent information on nonprofits.
It is not mandatory for nonprofit organizations to incorporate, and it is thought that thousands, if not tens of thousands, unincorporated groups carry out their activities across Canada each day. There have been studies on unincorporated nonprofits6 that have shown they tend to be smaller less structured groups. Some organizations are set up to address one issue and cease operations once that issue has been settled. A number of self-help groups are unincorporated and have operated this way for years.
The National Survey of Nonprofit and Voluntary Organizations, which is the most complete data set on the number of Canada’s nonprofits, surveyed 13,000 charities and incorporated nonprofits in 2003. Unincorporated nonprofits were excluded from this survey “because of the substantial difficulties identifying and locating them” (Hall et al., 2005, p. 8).
The amount of information available on the three types of organizations that make up the voluntary sector has meant that, for the most part, charitable organizations were well represented in the research, surveys, and studies undertaken on the voluntary sector. The results had less direct information on incorporated nonprofits, but over time, a picture began to emerge. The information on unincorporated voluntary organizations has provided little data in terms of their size, numbers, or composition.
A short history of voluntary sector research
Since the mid 1970s, researchers, voluntary sector organizations, and some government departments have worked hard to create estimates of the financial, economic, and volunteer contributions of Canada’s nonprofit sector. The goal of the research was to create measures that would place the voluntary sector in an economic context that would be familiar to Canadians. There were several pieces of information that were needed, including revenues and expenditures in the sector, the contribution to the GDP, and the number of nonprofits within the sector. This last piece was critical because, up until the NSNVO, there were only estimates on the number of incorporated non-charitable nonprofits.
It is difficult to choose a starting point when talking about research on the sector. Each study and report had its unique importance. Some works provided new information and valuable avenues to explore. The contribution of other reports, since the base of knowledge was so small to start with, was to show researchers areas that were less important. Many mark the start of voluntary sector information with the work of Samuel Martin. With his book Financing Humanistic Service (Martin, 1975), Martin provided a detailed analysis of the financing of health, education, welfare, and cultural organizations in Canada. He looked at how governments, individuals, corporations, charitable foundations, and other funds supported the sector. When combined with his later work, An Essential Grace, Martin (1985) provided some trend data on the financing of charities and incorporated nonprofit organizations.
Another seminal report was the 1983 publication Some Financial and Economic Dimensions of Registered Charities and Volunteer Activity in Canada. In 1980, Statistics Canada undertook a survey of the financial statements of Canada’s 39,965 registered charities to produce financial and economic estimates. The total estimated revenue for these charities, which excluded hospitals and teaching institutions, was $5.84 billion (Ross, 1983). Extrapolating from the total wage bill reported on the financial statements, it was thought that charities employed 175,000 paid workers (Ross, 1983). The report also included information taken from a 1980 household survey conducted by Statistics Canada, which estimated that there were 2.7 million Canadians (Ross, 1983) working as volunteers. This report was seen as an authoritative source of information on the size of the charitable sector, and it included national data on volunteering.
On the economic side, there were a number of smaller studies and reports that helped researchers better understand existing knowledge about the sector and its structure. Canada Gives was published in 1988 (Arlett, Bell, Thompson, & Gorman, 1988) and used surveys and other reports to look at trends in giving and volunteering. It looked at the number of charities, charitable donations, and individual and corporate philanthropy.
Donations to registered charities was based on an extensive sampling of information from the T1 Individual Income Tax Returns for 1986 and 1987 and produced information on the characteristics of donors (See Duern, 1991).
A Portrait of Canada’s Charities (Sharpe, 1994) used data from the 1991 T3010 public information returns for charities and a separate survey of registered charities to produce estimates on the size and scope of Canada’s charities. In retrospect, the study overestimated the size and contribution of the sector, but it did establish that the sector was large and a major contributing force to Canada’s economy. It also began a slow and study process to undertake work that would create more rigorous economic estimates.
After the volunteering survey results found in Some Financial and Economic Dimensions of Registered Charities and Volunteer Activity in Canada, sector groups and government departments worked toward a more comprehensive study on volunteering. Statistics Canada and the Secretary of State worked with sector representatives on the creation of a classification system for voluntary organizations (DPA Consulting Limited, 1983) and a questionnaire on volunteering that asked what activities people undertook when volunteering (see Statistics Canada, 1987). The result was the 1987 Survey of Volunteer Activity, a comprehensive look at how the 27% of the population or 5.3 million Canadians contributed to their society (Duchesne, 1989).
The volunteer survey was not repeated until 1997 and this only occurred after intense lobbying and the creation of a unique voluntary sector and Government of Canada partnership.7 The 1997 National Survey of Giving, Volunteering and Participating included estimates on the giving of funds, volunteering, and civic participation (Hall, Knighton, Reed, Bussière, McRae, & Bowen, 1998). The Survey found that in 1997, 31% of Canadians (7.5 million of them) volunteered and that Canadians gave $4.51 billion in donations (Hall et al., 1998). The Survey has been repeated in 2000, 2004, 2007, and 2010.
The success of this joint voluntary sector and government work led to the National Survey of Nonprofit and Voluntary Organizations. Undertaken in 2003, the survey found that there were over 161,000 nonprofit organizations in Canada with revenues totalling $112 billion (Hall et al., 2005). For the first time, Canadians had a reliable estimate on the size, scope, and nature of the voluntary sector. The NSNVO was designed, field tested, financed, and undertaken during the federal Voluntary Sector Initiative. Since the funding for this survey ended with the Initiative, it has not been undertaken again and there are no plans to repeat it.
The Satellite Account of Nonprofit Institutions and Volunteering reported on the macroeconomic contributions of charities and incorporated nonprofit organizations from 1997 to 2007 and underlined the sector’s important contribution to GDP. While the NSNVO and the Satellite Account came up with differing numbers for the nonprofit sector, a process of data reconciliation was carried out and it found that “the broad messages on the size and scope of the non-profit sector in economic terms coming out of the two programs were largely consistent” (Haggar-Guenette et al., 2009, p. 46). In other words, the sector was a large economic force in Canada.
By 2005, the sector had its statistics. Charities and incorporated nonprofit organizations were seen as having a large economic impact, even if hospitals, universities, and colleges were not included. The sector was a major employer. It involved millions of Canadians in volunteer activity and, in addition to its imputed labour cost, the skills learned while volunteering helped train Canada’s workforce. The research was an important factor in creating the momentum for changes to the Income Tax Act with respect to donations. The arguments about the philanthropic and social importance of charities and nonprofits to Canadian society were not lost, but, at times, they took a back seat to the economic discussions.
Current federal support to the voluntary sector
The 1960s and 1970s were marked by a series of policies and programs that saw voluntary groups as an extension and expression of citizen participation. Several federal departments, led by the Department of the Secretary of State, undertook programs that supported voluntary organizations to promote government policy. Citizens were encouraged to form groups in order to address issues and seek solutions. New programs were created and budgets increased.
As the years progressed, subsequent concerns with the federal budget deficit saw both Liberal and Progressive Conservative administrations undertake series of reductions. At first, budget cuts came to specific programs. This practice led to some difficult times when some organizations mounted strong campaigns to reverse the funding decisions.8
Succeeding governments changed tack and undertook budget reductions through a series of program reviews. These reviews had departments review all funding and reduce overall budgets in order to meet targets. The result of this policy was a series of reductions to programs across the scope of departments. Components of programs were eliminated, but many programs still operated.
In the mid 1990s, the Chretien administration went further and attacked expenditures by reducing program transfers to provinces. This had a cascading effect of reductions to provincial and municipal budgets affecting voluntary group funding at every level. That being said, sector organizations always felt that there was an implicit understanding of the value of the sector and its contribution, especially in the areas of policy development. This understanding has now changed. While it is the prerogative of any new government to change its funding priorities, recent changes have called into question how the current federal government views sector contributions to Canadian society.
The Conservative administration started, in September 2006, with the elimination of specific programs, such as the Canada Volunteerism Initiative and the Court Challenges Program. It has since moved on to restructure existing programs, such as international aid, and call into question assumptions about federal support. The government has challenged the idea of unbroken funding cycles; it has ignored the advice of its employees at the policy and program levels; it has reduced or eliminated support to research on the voluntary sector; and it has limited or eliminated support to advocacy and policy advice coming from the sector.
In June 2011, Finance Minister Jim Flaherty told arts institutions, “[t]hey ought not to assume entitlement to grants … no organization should assume in their budgeting that every year the government of Canada is going to give them grants because there’s lots of competition, lots of other festivals and there are new ideas that come along” (Oliveira, 2011, para. 8). This message was repeated to other parts of the sector, with groups who had received funding for decades finding that many of their proposals were no longer receiving federal support. In addition, long delays in groups finding out about funding decisions caused financial hardship.
The government has changed the way in which the advice of public employees is used. A case in point is the Canadian International Development Agency (CIDA). In a recent edition of the CBC program The House, Stephen Brown, Associate Professor of Political Science and the University of Ottawa called former CIDA minister Bev Oda a micro manager. He said that she did not take the advice of CIDA employees and she personally reviewed many of the project requests at CIDA. “She must have had the biggest desk in Ottawa because people were always being told the file was on the Minister’s desk. It would sit there for six months, a year, or more” (Brown, 2012). This was similar to the behaviour that had occurred when Ms. Oda was the Minister of Canadian Heritage.9
The Conservative administration has made a number of comments about the contribution of Canada’s voluntary sector groups, especially when these contributions are perceived as being against national interests. To quote the Globe and Mail editorial Tory rhetoric creates chilly climate for free speech, “Natural Resource Minister Joe Oliver called environmental groups ‘radicals’ serving foreign interests; Environment Minister Peter Kent accused these groups of “money laundering” and Conservative Senator Nicole Eaton added influence peddling.’” (Tory rhetoric creates chilly climate for free speech, 2012, para. 4).
The House also ran a segment called Funding organizations that disagree with government policy on June 9, 2012. The program opened the segment with the following quote from Stephen Harper, “If it’s the case that we’re spending on organizations that are doing things contrary to government policy, I think that is an inappropriate use of taxpayers’ money and we’ll look to eliminate it” (Funding organizations that disagree with government policy, 2012).10 One of the major concerns of sector organizations is that their policy development may raise questions about current government policy, and that these questions, by themselves, are being viewed as “contrary.” Some groups have also stated, off the record, that their defence of other groups whose funding had been reduced or eliminated has led to reductions in their own budgets.
Advocacy or political activities by charities are also in the federal sights. The March 29, 2012, budget contained measures to “increase transparency” on political activities undertaken by charities and included additional financial resources for the CRA to enhance its education and compliance activities in this area. The measures have not stopped there. A recent Globe and Mail article states that 16 of 20 proposals from the Canadian HIV/ AIDS Legal Network were rejected by Health Canada, with the funding decisions stating that, “It was unclear from the details provided in the proposal whether the resource would be used for advocacy purposes which is ineligible for funding” (Mehler Paperny, 2012, para. 3).
Canada’s history has been liberally marked by policy changes inspired by voluntary organizations. The campaigns against smoking, the changes to the laws concerning sexual assault, and the use of safe injection sites in the treatment of addictions are examples where groups have undertaken advocacy to challenge existing government policy. The current government actions are acting to eliminate voluntary sector counter-points to existing government policy.
Taken together, these actions have signalled a sea change in how the federal administration sees the voluntary sector. Funding for sector organizations is focused on service delivery and not policy development. The “Tory rhetoric” Globe and Mail editorial quotes Conservative Senator Hugh Segal on how the relationship has changed. “We are an open society with the free movement of people, goods, services and capital. This has always been the goal of those of us who are free traders at heart. Limiting this freedom for charitable foundations would be a destructive and retrograde step” (Tory rhetoric creates chilly climate for free speech, 2012, para. 6). The editorial concluded by stating that, “A country that marginalizes its charities would be so much poorer” (Tory rhetoric creates chilly climate for free speech, 2012, para. 8).
From the evidence, it appears that the Conservative government’s concept of charity is very different than that of its predecessors. Charities will receive funding for the delivery of a service, but not for their advice. The government will match individual donations for disaster relief, after the earthquake in Haiti for example, but it does not want a policy partner to improve the delivery of that aid. It is surprising that a fiscally conservative government would hark back to the Elizabethan “hand-out” to victims concept of charity and not the “hand-up” concept of helping people improve their situation. The challenge for the voluntary sector is that it has no concrete way to see if the change in attitude is also followed with changes to funding.
It should also be reported that federal support to voluntary sector research has changed. The Canada Survey of Giving, Volunteering and Participating (CSGVP) is being rolled into the General Social Survey, limiting comparability with previous surveys. In addition, there will be space and time limitations in using this platform, meaning that each iteration of the survey will be less comprehensive than the stand alone CSGVP. The CS- GVP has provided the sector with important market information on volunteering and, to a lesser degree, giving. It has been quite useful for the internal needs of organizations, but it has been less useful as an external tool. Changes to the CSGVP platform over the years have resulted in large fluctuations of the volunteer rate (31% in 1997, 27% in 2000, 45% in 2004, 46% in 2007, and 47% in 2010). These differences have limited the ability, except in general terms, to publicly present the volunteer rate.
The Satellite Account on Non-Profit Institutions and Volunteering will be folded into the new Canadian System of National Accounts and the economic information collected on the nonprofit sector will be less than what appeared in the Satellite Account. The information will not include hospitals, universities, and colleges and the core nonprofit sector will contain fewer organizations than previously. There will be a retroactive reconciliation of data to allow for comparison over time, but the numbers will be lower than appeared in the Satellite Account.
Tracing the results of decisions
The voluntary sector knows of organizations that have had their funding eliminated, but there are few ways to document this. The information contained in the March 2012 federal budget, the budget bill, or the Main Estimates show overall funding, but the figures are at too high a level to see funding of individual organizations. Departmental proactive disclosure of Grants and Contributions funding provides only basic data. Unless one knows the funding record of individual groups, this is a difficult source to use.
Organizations or researchers could, through carefully crafted access to information requests, ask to see the funding decisions of federal programs. One could start in 2004 in order to establish a baseline of support and then continue until the present. The challenge with this would be the amount of information that would need to be processed in order to arrive at an overall picture. At the present time, the charities database may be the best source that we have.
Charities database
As briefly described above, the CRA’s charities listings database is a wealth of time-specific information.11 It is a record of all the organizations that have been registered and recognized as charities in Canada. As of August 3, 2012, a total of 118,517 organizations had been registered as charities in Canada. Of these, 85,937 groups were still registered charities. The other 32,580 groups had lost their charitable status either through the revocation or annulment processes.
table 1—number of all charities (Registered, revoked, and annulled)
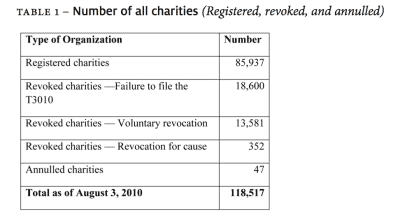
When new organizations become registered charities, the database increases. As charities are deregistered or annulled, these groups are not taken from the database, but can be found in the deregistered or annulled parts of the database. This means that the number of registered and deregistered charities changes with time. Unless otherwise mentioned, the numbers used in this article come from a paper that provided a snapshot of Canada’s charities in November 2010 (McRae, 2011).
Database listings of types of organizations
The database can be manipulated in a number of ways in order to search it. For example, one can either type in the name of a specific charity or use keywords such as “boy scouts” or “library.” For example, the database had 145 listings for “boy scouts” and only 10 of these or 7% remain charitable organizations. Of the remaining 135 groups (93%), 87 were revoked for failure to file and 48 voluntarily had their status revoked. While it may look that the number of scout packs are diminishing, it could also be that these organizations found that the charitable status was not useful to them and let their status lapse.
One can use the database to see the pattern of groups that have had their status revoked. Comites des oeuvres charitables are community benefit organizations that undertake charitable works at the local level in Québec. There were a total of 490 groups registered as charities under this heading. In November 2010, there were 230 comites (47%) still registered as charities. Of the 260 groups (53%) that were deregistered, 197 were for failure to file and 63 were voluntary revocations. One possible explanation for the reduction in the numbers is that these groups are now less relevant than they had once been.
The database can also show the growth of certain groups. There were 353 organizations using the term “food bank” that were registered as charities. Of these 308 (87%) were still charities in November 2010. Of the 45 (13%) groups that were deregistered, 29 were for failure to file, 15 were voluntary and one was for cause. The first modern food bank was registered in 1982. The other 307 groups have registered at a steady pace with new registrations every year from 1982 to 2010.
The database can trace the history of types of funds. A total of 709 organizations have been registered with the word “employees” in their name. The majority of these were employee funds set up to disburse funds for local needs. In November 2010, only 186 (26%) of these employee groups still had their charitable registration. Of the 523 (74%) groups that have been deregistered, 314 have been for failure to file and 209 have voluntarily deregistered. The first employee funds to be deregistered occurred in 1989 with 62 groups being deregistered in that year. Since that time, the groups have been deregistered in ebbs and flows. In the last twenty years, only 29 of these groups have been registered as charities.
The database can explore the flows of types of groups. A total of 124 Lions Clubs have been registered as charities. Currently, only 54 (44%) of these groups remain charities. Seventy (56%) of these groups have been revoked (52 for failure to file and 18 voluntarily). A total of 358 groups have been registered using the name Rotary Club. Of those, 277 (77%) remain charities and 81 (23%) were revoked (60 for failure to file and 21 as voluntary revocations). The Kiwanis have a number of different types of organizations (gener—al organizations, foundations for education or welfare) that have been registered under the headings of community benefit, welfare, and education. There were 219 groups registered under this name, and, as of November 2010, there were 148 charities (68%) and 71 organizations (32%) that had been revoked (56 for failure to file and 15 voluntarily).
As would be expected, the database shows that some types of religious groups are declining as demographics change and the population grows less religious. The term “fabrique” (usually found with de la paroisse or the name of a parish) was found 1,735 times in the charities database. The term indicates the name of a Roman Catholic parish or chapel. Of the 1,735 entries, 1,275 (73%) were charities and 460 (27%) had been revoked (428 voluntarily and 32 for failure to file). The pattern of revocations started in 1989, but the numbers were larger and more consistent from 1999 onward. From 2005 to 2010 (as of November 5, 2010), there were 43 new registrations. In the same time period, there were 272 revocations.
Intersection with government policies
Using information on the revenues reported by groups, the charities database can be very effective to confirm funding reductions if one knows the name of the affected organization.12 For example, the Canadian Council on Social Development reported that it received $1.556 million in 2005 from the federal government. That figure had been reduced to $0.051 million in 2011. The Canadian Research Institute for the Advancement of Women received $0.355 million in 2006 and $0.000 million in 2011. KAIROS, the organization made infamous by the word “not,” went from $1.772 million in 2009 to a reported $0.000 million in 2010. The Canadian Council for International Cooperation went from $1.772 million in 2008 to $0.574 million in 2011.
Without knowing the name of affected groups, it becomes more difficult to trace the effect of government funding decisions. That being said, some patterns in the charities database appear to indicate the effects of government policy changes. There are a number of cases where similar organizations lose their charitable status in the same time period and in the same province. In many cases, these revocations coincide directly with major restructuring of government spending.
There are 324 organizations with the name “public library” registered as charities, but only about 90 are what would normally be considered a local public library (other groups included Friends of the Public Library or private collections). The charities database shows that from 2000 to 2003, 37 public libraries or public library boards were revoked in Ontario reflecting, in part, the results of amalgamation of cities during that time. For example, amalgamation of the City of Ottawa occurred in 2001 and four area libraries had their status voluntarily revoked in 2002 (Nepean, Kanata, Vanier, and Ottawa).
Conclusion
The voluntary sector in Canada is in transition and the extent of this transition, in policy terms, is quite apparent given statements by the current federal administration and its representatives. What is not apparent is how the changes have affected the numbers and financial health of sector organizations.
The sector has little working knowledge of its size, in terms of the number of groups that exist. For charities, this is less of a problem because of the data found in the charities database. We know that, on August 3, 2012, there were 85,937 charities. We also know that 32,850 nonprofits once had charitable status, but we do not know if these groups ceased operation or continued as nonprofits. It is hard to imagine any other part of the economy that does not know its size. For example, the “About Us” section of the Canadian Federation of Independent Business website states that there are 109,000 small business owners from coast to coast. The voluntary sector can only say that in 2003 it had 161,000 organizations.
As was stated earlier, there will be major changes to the CSGVP and the Satellite Account. The way in which this research will be undertaken will change, and sector organizations will have to rework the ways in which they report the results. The NSNVO will not be repeated. In other words, the three major research pieces for the sector have changed. There is no bright light on the horizon. Given the extent of reductions to Statistics Canada, it will take years for that department to get back to its former size and ability. With these changes, information on the sector coming from the federal government will be severely curtailed. Perhaps it is time for the sector to set out its own research agenda.
Of all the surveys, the NSNVO has the broadest implications for the voluntary sector in terms of monitoring the number of organizations, the size of the sector, and changes to its composition. The survey methodology, the questionnaire and the other important pieces have been created and tested. Another survey, using a different and more economical collection method, could be undertaken by the sector and repeated every few years. The survey would not have to survey 13,000 organizations, but could use a smaller, but still representative, sample size.
The sector hears of examples of groups that have had their funding reduced or eliminat—ed, but there are few ways to document this, except in an anecdotal fashion. This is not the first time that the sector has been through this situation. For years, voluntary sector organizations have watched as parts of the sector were affected by budget reductions. In some cases, as with reductions to women’s centres in 1990, the organizations were easily identified as they were singled out in the federal budget speech. In most other cases, it has been difficult to identify the groups affected by changes.
If sector organizations want to understand the effects of government policy, then there has to be a concentrated effort to monitor the changes to program funding and to identi—fy those groups that have been affected. The sector could use targeted access to information requests or proactive disclosure to see how program funding has changed over the years and to see which organizations have lost or gained funding. Given the information available on the T3010, looking at the charities database would also be a good starting point. Providing the research questions are properly framed and based on accurate information from the affected groups, the database is able to provide a reliable assessment. Otherwise, the sector will continue to be on the outside looking at the changes, but being unable to comment on the extent of the changeover.
For incorporated non-charitable nonprofits, there are nodes of information in the databases of the Societies Acts or Corporations Acts of the provinces and, federally, in the Canada Corporations Act, but these are not public. There is also the database of the T1044 for the larger non-charitable nonprofits. For the sector, the first step would be to ask that, at the very least, high-level information be made available showing the number of organizations found in these databases, along with information on their assets, liabilities, revenues, and expenditures. This information should also indicate the number of registered charities contained in these databases so that the number of non-charitable nonprofits is discovered.
The next step would be to have all of the information in the databases made public. Section 241 of the Income Tax Act could be amended to allow the CRA to make information from the T1044 public.13 Similar changes would be needed at the federal (Canada Corporations Act) and provincial levels. The information would have to show which groups were non-charitable nonprofits and which groups had charitable status in order to avoid double counting, but this can be done. Publicly available databases would give the sector a decent fact-based estimate on its size.
Otherwise, we are left with conjecture on what is happening to the sector.
Notes
1. The core nonprofit institutions include all nonprofit institutions serving households and nonprofit institutions classified to the corporate sector as per the classification used in the Satellite Account of Nonprofit Institutions and Volunteering (Haggar-Guenette et al., 2009).
2. The Voluntary Sector Initiative was a joint Government of Canada–voluntary sector undertaking to work on common issues. The work included the regulation of charities, research, building the capacity of sector organizations, and efforts to increase volunteerism.
3. A charity can voluntarily ask that its status be revoked, it can be revoked for failure to file the T3010 public information return or it can be revoked for cause, when the charity fails to meet the requirements of the Income Tax Act. In addition, a charity can have its registration annulled. This is used when it is thought that the registration was granted in error. Once an organization has been deregistered or annulled, it files its last T3010 and the data record ends there.
4. See http://www.ic.gc.ca/eic/site/cd-dgc.nsf/eng/h_cs01440.html .
5. Figures provided from an unpublished paper “Toward a Charitable Marketplace by Canadian Heritage,” which was undertaken by the Voluntary Action Directorate in 1994 and 1995.
6. See, for example Hill (1984).
7. The survey partners were the Canadian Centre for Philanthropy, the Non-Profit Sector Research Initiative, Volunteer Canada, and the Departments of Canadian Heritage, Health Canada, Human Resources Development Canada, and Statistics Canada.
8. For example, pressure from women’s organizations in 1990 caused the then Progressive Conservative government to restore some of the funding to women’s centres.
9. The author worked at Canadian Heritage during Ms. Oda’s tenure.
10. Citing Stephen Harper while in Europe.
11. See http://www.cra-arc.gc.ca/chrts-gvng/lstngs/menu-eng.html .
12. It should be cautioned that these revenue figures are produced by the organization, but the resultant data can certainly show trends.
13. It should be noted that this was a recommendation made by Mark Blumberg in his appearance before the Standing Committee on Finance on the Braid motion (to examine current and proposed measures to increase tax giving) on May 8, 2012, Ottawa, ON.
Websites
Canada Revenue Agency. Charities listings. URL: http://www.cra-arc.gc.ca/chrts-gvng/lstngs/menu-eng.html
Corporations Canada. Monthly transactions. URL: http://www.ic.gc.ca/eic/site/cd-dgc.nsf/eng/h_cs01440.html
References
Arlett, A., Bell, P., Thompson, R. W., & Gorman, J. (1988). Canada gives: Trends and attitudes towards charitable giving and voluntarism 1988. Toronto, ON: Canadian Centre for Philanthropy.
Brown, Stephen. (2012, July 7). The legacy of Bev Oda’s controversial tenure. [Radio].
The House, CBC.
DPA Consulting Limited. (1983). The development of a typology of the voluntary sector in Canada. Ottawa, ON: Secretary of State.
Duchesne, D. (1989). Giving freely: Volunteers in Canada. Ottawa, ON: Minister of
Supply and Services Canada.
Duern, N. (1991). Donations to registered charities: Revenue Canada taxation data for
1986 and 1987. Ottawa, ON: Multiculturalism and Citizenship Canada.
Funding organizations that disagree with government policy. (2012, June 9). [Radio].
The House, CBC.
Haggar-Guenette, C., Hamdad, M., Laronde-Jones, D., Pan, T., & Yu, M. (2009). Satellite account of non-profit institutions and volunteering 2007. Ottawa, ON: Minister of Industry.
Hall, M. H., de Wit, M. L., Lasby, D., McIver, D., Evers, T., Johnston, C., McAuley, J., Scott, K., Cucumel, G., Jolin, L., Nicol, R., Berdahl, L., Roach, R., Davies, I., Rowe, P., Frankel, S., Brock, K., & Murray, V. (2005). Cornerstones of community: Highlights of the National Survey of Nonprofit and Voluntary Organizations, 2003 revised edition. Ottawa, ON: Industry Canada.
Hall, M., Knighton, T., Reed, P., Bussière, P., McRae, D., & Bowen, P. (1998). Caring Canadians, involved Canadians: Highlights from the 1997 National Survey of Giving, Volunteering and Participating. Ottawa, ON: Minister of Industry.
Hill, K. (1984). Helping you helps me: A guide book for self-help groups. Ottawa, ON: Canadian Council on Social Development.
Martin, S. A. (1975). Financing humanistic service. Toronto, ON: McClelland and Stewart. Martin, S. A. (1985). An essential grace. Toronto, ON: McClelland and Stewart.
McRae, Don. (2011). Composition and movement of charities: Patterns in the registration and de-registration of charities. [Unpublished paper].
Mehler Paperny, A. (2012, August 6). Fearing advocacy, Ottawa rejects HIV/AIDS funding proposals. The Globe and Mail. URL: http://www.theglobeandmail.com/news/ politics/fearing-advocacy-ottawa-rejects-hivaids-funding-proposals/article4465894 [September 7, 2012].
Ross, D. P. (1983). Some financial and economic dimension of registered charities and volunteer activities in Canada, Ottawa, ON: Department of the Secretary of State.
Sharpe, D. (1994). A portrait of Canada’s charities: The size, scope, and financing of registered charities. Toronto, ON: Canadian Centre for Philanthropy.
Statistics Canada. (1987). Survey of volunteer activity forms number 06 (screening questionnaire) and 08 (in-depth survey). Ottawa, ON: Statistics Canada.
The Canada Gazette Directorate. (2012). Canada Gazette. URL: http://www.gazette
.gc.ca/index-eng.html [September 6, 2012].
Tory rhetoric creates chilly climate for free speech. [Editorial]. (2012, May 14; updated 2012, June 18). The Globe and Mail. URL: http://www.theglobeandmail.com/ commentary/editorials/tory-rhetoric-creates-chilly-climate-for-free-speech/ article4178645 [September 7, 2012].
Voluntary Action Directorate. (1994, 1995). Toward a charitable marketplace by
Canadian Heritage. [Unpublished paper].
Don McRae is a retired federal public employee who spent over 30 years working with voluntary organizations. He is currently writing and consulting on voluntary sector issues.
Email: donmcrae@bell.net .