Introduction
Research commissioned by The Muttart Foundation indicates that Canadians have high expectations regarding the transparency of charities. For example, in three surveys conducted between 2004 and 2008, between 95% and 99% of Canadians said it was either very important or somewhat important for charities to provide information on their impact, programs and services, how they use donations, and fundraising costs (Ipsos Reid Public Affairs, 2008). However, only between 26% and 51% of Canadians thought that charities were doing a good or excellent job of providing these various types of information. The perception—correct or not—that charities are not as transparent as they should be has negative consequences for both individual charities and the sector as a whole. For individual charities, the impact may be seen in reduced donations and volunteer rates. For the sector as a whole, it can be seen in efforts such as Bill C-470 to impose greater legal restrictions on charities.
In response to these challenges, Imagine Canada has recently taken several steps to promote transparency in the sector. These include piloting a new Standards Program for charities and public-benefit nonprofits and launching a new web portal called CharityFocus (http://www.charityfocus.ca) that provides detailed information on all 85,000 Canadian charities. To gather baseline data that can be used to evaluate the impact of these initiatives, we used our Sector Monitor survey to ask charities about the extent to which they publicly disclose key information commonly demanded by stakeholders. Their responses provide insight into the current state of transparency in Canada’s charitable sector.
Background
The questions covered here were included in Imagine’s fourth Sector Monitor survey. The Monitor is an ongoing program designed to track changes in the health and vitality of the charitable sector and to explore specific topics of relevance to the sector.1 This version of the survey was conducted between May 25 and June 30, 2011.2 Survey findings are weighted by region, organizational revenues, and activity area to produce estimates that are more representative of Canadian charities overall.
Survey Findings
Respondents were asked about their policies on disclosure of four key pieces of information:
• the organization’s annual report;
• the organization’s financial statements;
• the organization’s fundraising revenues and expenses; and
• the names of all board members.
Respondents were asked whether their organization disclosed this information without being asked, released it on request, or did not publicly release it. Substantial majorities of charities reported that they release each of the four pieces of information, either proactively or on request (see Table 1). In terms of proactive disclosure, over half of organizations released their board composition and annual reports proactively, but only about a third did so with their financial statements and information pertaining to fundraising revenues and costs.
Table 1: percentage of charities releasing key information.
| Board member names |
Annual report |
Financial statements |
Fundraising revenue and costs |
|||||
|---|---|---|---|---|---|---|---|---|
|
On request |
Proactive |
On request |
Proactive |
On request |
Proactive |
On request |
Proactive |
|
|
All Charities |
27% |
67% |
30% |
54% |
48% |
35% |
47% |
30% |
|
Designation |
||||||||
|
Foundation |
19%* |
68% |
18%* |
57% |
37%* |
39% |
35%* |
34% |
|
Operating Charity |
28% |
66% |
33%* |
54% |
51%* |
34% |
49%* |
29% |
|
Revenue Size |
||||||||
|
$30,000 to $149,999 |
31%* |
59%* |
36%* |
41%* |
47% |
30%* |
43% |
27%* |
|
$150,000 to $499,999 |
27% |
68% |
34%* |
53%* |
51% |
34% |
50% |
28% |
|
$500,000 to $1,499,999 |
23% |
71% |
27% |
63%* |
51% |
38% |
50% |
30% |
|
$1,500,000 to $4,999,999 |
19%* |
78%* |
26% |
67%* |
52% |
36% |
48% |
33% |
|
$5,000,000 or more |
13%* |
84%* |
10%* |
85%* |
33%* |
58%* |
39%* |
44%* |
|
Activity Area |
||||||||
|
Arts, Culture, Sports & Recreation |
29% |
67% |
44%* |
38%* |
58%* |
24%* |
52% |
20%* |
|
Education & Research |
16%* |
77%* |
29% |
53% |
42%* |
41% |
42% |
32% |
|
Health |
30% |
66% |
25%* |
66%* |
47% |
40% |
53% |
31% |
|
Social Services |
34%* |
60%* |
36%* |
54% |
54%* |
33% |
52%* |
27% |
|
Philanthropic Intermediaries & Voluntarism |
17%* |
72% |
18%* |
61%* |
38%* |
42%* |
35%* |
36%* |
|
Other |
25% |
68% |
28% |
58% |
48% |
38% |
43% |
34% |
|
Unknown |
26% |
68% |
28% |
57% |
50% |
33% |
52% |
28% |
|
Region |
||||||||
|
BC |
26% |
67% |
37%* |
48%* |
60%* |
28%* |
53%* |
22%* |
|
AB |
34%* |
58%* |
32% |
53% |
49% |
35% |
49% |
30% |
|
PR |
29% |
66% |
39%* |
52% |
55% |
33% |
54% |
29% |
|
ON |
25% |
70%* |
29% |
57% |
49% |
37% |
50% |
29% |
|
QC |
24% |
68% |
24%* |
59%* |
39%* |
41%* |
36%* |
35%* |
|
AT |
28% |
64% |
35% |
49% |
46% |
34% |
42% |
31% |
|
Paid Staff |
||||||||
|
No paid staff |
31% |
54%* |
30% |
37%* |
40%* |
29%* |
38%* |
27% |
|
1 to 4 |
27% |
66% |
33% |
49%* |
49% |
32% |
48% |
27% |
|
5 to 9 |
28% |
70% |
32% |
59% |
50% |
41%* |
48% |
35%* |
|
10 to 24 |
25% |
69% |
29% |
62%* |
53%* |
35% |
52%* |
28% |
|
25 to 99 |
27% |
68% |
28% |
65%* |
50% |
38% |
51% |
29% |
|
100 or more |
16%* |
82%* |
17%* |
76%* |
42% |
48%* |
40% |
39%* |
* value statistically different from value for all charities at 0.05 level
Some types of charities were more likely to report releasing information than others. This was particularly true of the proactive release of information (see Table 1). The following general patterns can be seen in the data:
• Larger organizations (as measured by annual revenues) were more likely to release information proactively than were smaller organizations.
• Organizations with the largest paid staff complements were more likely to release information proactively, while those with no paid staff were less likely to do so.
• Quebec organizations were more likely to release most forms of information proactively, while organizations in British Columbia were more likely to release most information in response to requests.
• Arts, Culture, Sports & Recreation organizations were less likely to release most forms of information proactively and more likely to release them on request.
• Social Services organizations were also more likely to release most forms of information on request.
• Interestingly, foundations were more likely to release most forms of information proactively and not to publicly release it at all—this finding appears to be driven largely by differences between public foundations (which were more likely to release information proactively) and private foundations (which were more likely not to release information at all).
Table 2: respondent charities by revenue dependency.
|
Board member names |
Annual report |
Financial Statements |
Fundraising revenue and costs |
|||||
|---|---|---|---|---|---|---|---|---|
|
On request |
Proactive |
On request |
Proactive |
On request |
Proactive |
On request |
Proactive |
|
|
All Charities |
27% |
67% |
30% |
54% |
48% |
35% |
47% |
30% |
|
Revenue Dependency |
||||||||
|
Donations |
22%* |
73%* |
26%* |
59%* |
47% |
38% |
45% |
35%* |
|
Government |
31%* |
64%* |
31% |
60%* |
50% |
38% |
50%* |
29% |
|
Earned Income |
25% |
64% |
29% |
43%* |
45% |
27%* |
41%* |
23%* |
|
Mixed |
29% |
68% |
42%* |
47%* |
56%* |
32% |
48% |
28% |
* value statistically different from value for all charities at 0.05 level
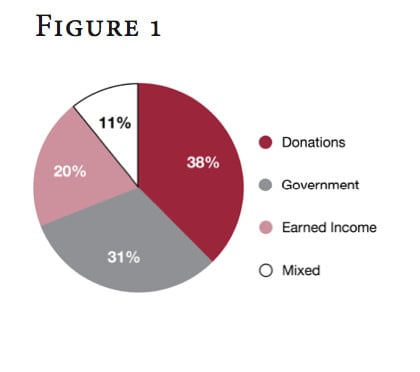
In addition to variation by the characteristics discussed above, the likelihood of publicly disclosing information varies according to how charities obtain the bulk of their funding.3 Roughly two fifths of charities surveyed depended on donations for the majority of their revenues, about a third depended on revenues from government, a fifth on earned income,4 and about one in ten drew on a mix of sources (see Figure 1).
Organizations that rely primarily on donations were more likely than charities generally to proactively disclose their board composition, annual report, and fundraising revenues and costs (see Table 2). Charities relying primarily on government revenues were more likely than charities as a whole to release their annual report proactively and their board composition and fundraising revenues and costs in response to a request. Neither charities that depend primarily on donations nor those that depend on government were statistically more likely than charities generally to release their financial statements. Charities that depend primarily on earned income for their revenues were considerably more likely to report that they do not publicly release all four forms of information.
Conclusion
Overall, the findings presented here go some way to explaining why Canadians believe charities are not being as transparent as they could be. Although the majority of organizations claim that they release the types of information we inquired about at least when requested to do so, rates of proactive disclosure are substantially lower. This is particularly true for financial information that is—rightly or wrongly—the information in which many people are most interested. If we are to improve the image of the sector in the eyes of Canadians, more charities need to begin proactively disclosing the information that Canadians are seeking.
Notes
1. For more information on the Sector Monitor please refer to: http://www.imaginecanada.ca/sector_monitor
2. This edition of the online survey was distributed to 7,341 leaders of registered charities. Responses were received from 2,854 of them, for a total response rate of 39%. Participation in the survey was limited to charities with annual revenues of $30,000 or more that were not religious congregations. The survey was limited to registered charities in order to allow for comparison with T3010 information available from Canada Revenue Agency.
3. Information on funding sources was derived from the T3010 Registered Charity Information Returns of the charities that responded to the survey.
4. This category includes both investment income and income from providing goods and services for a fee. Notably, because of the nature of the data collected by the T3010, this does not include earned income sources provided to government.
Reference
Ipsos-Reid Public Affairs. (2008). Talking about charities 2008: Canadians’ opinions on charities and issues affecting charities. The Muttart Foundation: Edmonton, AB.
David Lasby is the Director of Research at Imagine Canada. Email: dlasby@imaginecanada.ca
Cathy Barr is Senior Vice- President at Imagine Canada. Email: cbarr@imaginecanada.ca