Abstract: Canada has one of the largest and most vibrant nonprofit and voluntary sectors in the world. It accounts for 6.8 percent of the nation’s gross domestic product (GDP) and employs 12 percent of Canada’s economically active population. With the significant role nonprofit organizations play in Canadian life and the increasing demand for accountability in nonprofit organizations, more attention is being drawn to nonprofit organizational fraud. Media coverage on fraud in nonprofit organizations is news that catches the public’s eye and can lead to a reduction in trust in those organizations over time. This study searched Canadian national and leading regional newspapers between 1998 and 2008 for reports about frauds committed on Canadian nonprofit organizations. The goal of the research was to better understand the nature of the frauds, the nonprofit organizations defrauded and the characteristics of the perpetrators, with the hope of alerting the nonprofit community to common trends.
Résumé: Le Canada a l’un des secteurs non marchands et bénévoles les plus vastes et dynamiques au monde. Il représente 6,8% du produit intérieur brut (PIB) du pays et emploie 12% de sa population économiquement active. À cause du rôle important joué par les organismes sans but lucratif dans la vie canadienne et les demandes croissantes que ceux-ci se responsabilisent davantage, on porte une plus grande attention à la fraude dans ce secteur. La couverture médiatique de cas de fraude dans les organismes sans but lucratif capte immanquablement l’intérêt du public et peut faire diminuer sa confiance à leur égard au fil du temps. Cette étude consiste en une recherche, dans les principaux journaux régionaux et nationaux parus entre 1998 et 2008, d’articles sur les fraudes commises envers les organismes sans but lucratif canadiens. L’objectif de la recherche est de mieux comprendre la nature de ces fraudes, les organismes atteints par celles-ci et les caractéristiques des fraudeurs dans l’espoir d’informer la communauté sans but lucratif sur la fraude.
To emphasize the positive side of the nonprofit story, in 2008 the CA-Queen’s Centre for Governance created the Voluntary Sector Reporting Awards to recognize transparency in governance and financial reporting. To nominate an organization visit the 2009 Awards website at http://business.queensu.ca/ centres/CA-QCG/voluntary_ sector_reporting/index1.php.
Introduction
Organizational fraud (fraud committed in the course of one’s employment) poses a significant problem around the world. In a recent worldwide survey, Pricewaterhouse-Coopers found that nearly one out of two companies had been victim to a fraud in the last two years (Pricewaterhouse-Coopers, 2007). Much attention has been given to fraud within for-profit organizations, especially public companies (see, for example, the Sarbanes-Oxley Act of 2002 in the United States). However, fraud poses an equally significant threat to nonprofit organizations. This article explores fraud within Canada’s nonprofit organizations.
Canada has one of the largest and most vibrant nonprofit and voluntary sectors in the world. It accounts for 6.8 percent of the nation’s gross domestic product (GDP) and employs 12 percent of Canada’s economically active population (Hall, Barr, Easwaramrthy, Sokolowski & Salamon, 2005). With the significant role nonprofit organizations play in Canadian life and the increasing demand for accountability within nonprofit organizations, more attention is being drawn to nonprofit organizational fraud.
This article examines media coverage of fraud within Canadian nonprofit organizations, and how this type of news catches the public’s eye and can lead to a reduction in trust in nonprofit organizations over time (Freman-Smith & Kosaras, 2003). The study on which the article is based searched Canadian national and leading regional newspapers between 1998 and 2008 for reports about frauds committed on Canadian nonprofit organizations. The goal of the research was to better understand the nature of the frauds, the nonprofit organizations defrauded and the characteristics of the perpetrators, with the hope of alerting the nonprofit community to common trends.
We found that the median loss from fraud within Canadian nonprofit organizations was $27,244, significantly smaller than the median loss of US$100,000 for nonprofits in the United States in 2004 (Greenlee, Fischer, Gordon, & Keating, 2007). However, the median fraud loss in Canada represents about 5% of annual revenues, quite close to the Association of Certified Fraud Examiners (ACFE) estimate of 7% of annual revenues for all U.S. organizations (ACFE, 2008). Smaller nonprofit organizations—those employing fewer than 50 people and/or having annual revenues of less than $100,000—experienced the most number of fraud cases and the highest losses relative to their annual revenue. Fraud losses for the smallest nonprofit organizations—those with annual revenues less than $100,000—accounted for a median of 72% and a mean of 119% of annual revenue.1
Nonprofit organizations located in the largest cities (those with populations of greater than one million) experienced close to half of all reported frauds and a relatively higher median loss of $38,000.
The detection of fraud is different in Canadian nonprofit organizations as compared to that in organizations in other countries. Tips are the most productive method of detecting fraud both worldwide (PricewaterhouseCoopers, 2007) and in U.S. nonprofit organizations (Greenlee et al., 2007), whereas the audit function (both external and internal) appears to be the primary detection method for Canadian nonprofit organizations. We found that fraudsters within Canadian nonprofit organizations had a slightly different face than those in the rest of the world along one dimension: gender. The typical Canadian perpetrator is almost as likely to be a woman as a man (46% were women and 54% were men), whereas perpetrators worldwide are overwhelmingly male (85%) (PricewaterhouseCoopers, 2007). The gender breakdown in the U.S. is closer to that of Canada (60% of U.S. perpetrators were male; ACFE, 2008), but the Canadian literature still points to more female perpetrators than most other fraud literature. We posit this difference might reflect the greater percentage of women employed by nonprofit organizations in general.
Our remaining findings on fraudsters are in line with other countries. Canadian perpetrators tended to be in their 30s, 40s, or 50s. This finding differs only slightly from fraud worldwide, which is dominated by perpetrators in their 30s (Pricewaterhouse Coopers, 2007) and in the U.S., where it is dominated by those in their 40s (ACFE, 2008). In line with other fraud literature, we found that top management (CEOs, and other managers) were the perpetrators in the greatest percent of cases (30%) followed by the CFO/financial staff, and hired fundraisers (28% for each group). The ACFE (2008) also reported that in half of all fraud cases, either the accounting department or upper management were involved in committing the fraudulent act.
Comparing our overall data to fraud statistics elsewhere, we found that fraud losses appear to be lower (in absolute terms) in Canadian nonprofit organization NFPs than in those in the U.S. or worldwide. However, such results could be misleading for three reasons. First, much fraud goes unreported (ACFE, 2008). We compared our results from media outlets only against anonymous-on-anonymous surveys of members of the ACFE conducted both in the U.S. and around the world. Second, nonprofit organizations may be especially reluctant to release information about fraud because of the negative impact on fundraising (Greenlee et al., 2007), hence only cases serious enough to warrant criminal charges tend to come to the attention of the media. More than 80% of companies experiencing fraud worldwide indicated that the fraud damaged their business (PricewaterhouseCoopers, 2007). One might reasonably expect the damage to be even greater for a nonprofit organization whose supporters might question the efficacy of their contributions if the organization cannot safeguard them before they are spent. Finally, the Canadian media in this study did not report many final outcomes of fraud (52% of cases reported in the media are charges only), while data from other countries that used different sources reported completed fraud cases.
This article begins by describing our research method and analysis approach. It then presents our findings: the cost of fraud, types, detection, the characteristics of the defrauded nonprofit organizations and the perpetrators. It concludes with observations and a call for more attention to fraud within this important segment of Canada’s economy.
Research method
We searched newspaper articles in the “Canadian Newsstand” database, which includes The Globe and Mail and National Post, leading regional newspapers (e.g., Calgary Herald, Edmonton Journal, and Vancouver Province) and the largest Canadian daily newspaper, The Toronto Star. We used a combination of keywords defining the nature of the organization, such as “nonprofit,” with words related to fraud, such as “theft” (see the appendix for the full list of search terms). This netted a total of 6,645 news articles, most of which turned out to be irrelevant to our study. We screened these articles and retained only those fraud cases committed by employees (e.g., managers or executives) or legitimate associates (e.g., hired fundraisers, volunteers, or board members) of nonprofit organizations.
We excluded from our sample three types of fraud relating to nonprofit organizations. First, we excluded frauds committed on third parties by non-existent charitable organizations or bogus “charitable” organizations that did not carry out charitable work. Second, we excluded frauds committed by taxpayers in collusion with charitable organizations to inflate income tax receipt values (to claim a charitable deduction in Canada, a taxpayer must have a receipt issued by a registered charity) and defraud the government. Third, we excluded frauds in which people represented themselves as collecting funds on behalf of a legitimate nonprofit organization when there was no connection between the person and the organization and when all reasonable attempts had been made by the nonprofit organization to ensure that its legitimate representatives were clearly designated (e.g., had been issued official credentials that were not easy to copy) that advanced publicity had been done about any door-to-door canvassing, and that other measures aimed at reducing the possibility of fraud had been taken.
A research assistant and one of the co-authors carried out the search and the coding independently. The first research assistant, a recent Bachelor of Commerce graduate, did the initial searches and coding of the data. The co-author replicated roughly 25% of the searches until she was satisfied with the completeness and the accuracy of the recent graduate’s searches. The co-author reviewed 100% of the initial coding of the data and, in consultation with a second co-author, made judgment calls as to what news reports to include or exclude. Using these criteria and this process, we located a final sample of 114 unique fraud cases that were reported on in the media between 1998 and 2008. The actual frauds themselves cover a longer period, from 1986 to 2006.
Nature Of Frauds In Canadian Nonprofit Organizations
The cost of fraud to nonprofit organizations
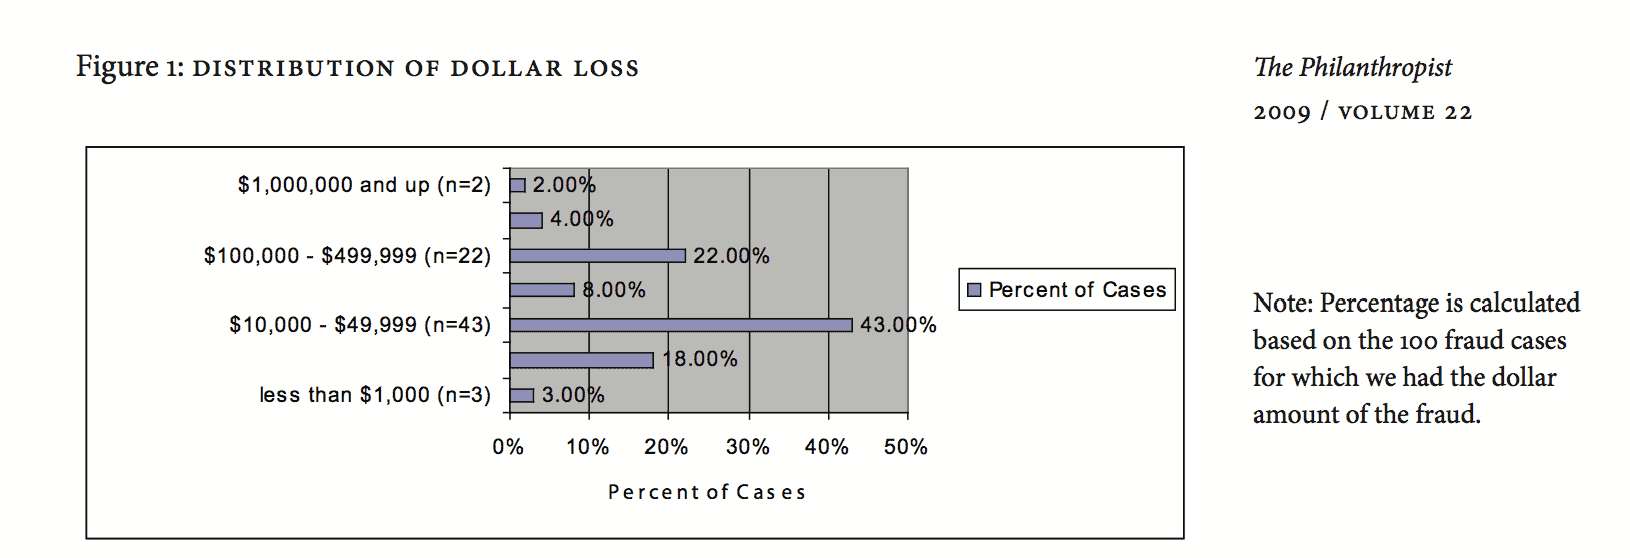
The total dollar loss of nonprofit organizations as reported in 100 out of the 114 cases ranged from $474 to $2,300,000. The mean loss for these cases was $119,821; the median was $27,244. The mean was much larger than the median (a difference of $92,577), which means that the typical fraud was relatively small and that a few very large frauds increased the overall average. As Figure 1 shows, 59% of the nonprofit organizations in our study were defrauded of less than $50,000, with 43% of fraud cases clustered between $10,000 and $49,999. However, loss as a percentage of annual revenue ranged from almost 0% to over 350%. This percentage is only a rough picture of the severity of fraud because matching fraud loss to a particular year’s revenue figure was difficult, both for the fraud and the revenue amount in the year.2
The type of fraud
We found enough information for 82 of the 114 fraud cases to classify them into the three fraud categories—asset misappropriation, corruption, and fraudulent financial statements—used by the ACFE (ACFE, 2008), which provides one of the most compre-
hensive reports on fraud in the private sector. Almost all (96% or 76 out of the 82 cases) of nonprofit fraud involved the first type of fraud: asset misappropriation, which includes the theft of cash by various means, such as fraudulent invoicing, payroll fraud, and skimming revenues. Only one case involved the second type of fraud, corruption, in which a person uses his or her influence in a business transaction to obtain an unauthorized benefit contrary to that person’s duty to his or her employer. This includes accepting or paying a bribe and engaging in a business transaction in which there is an undisclosed conflict of interest. Two cases involved the third type of fraud, fraudulent financial statements, in which a person falsifies an organization’s statements to make the organization appear more financially stable than it really is.
Detection of fraud
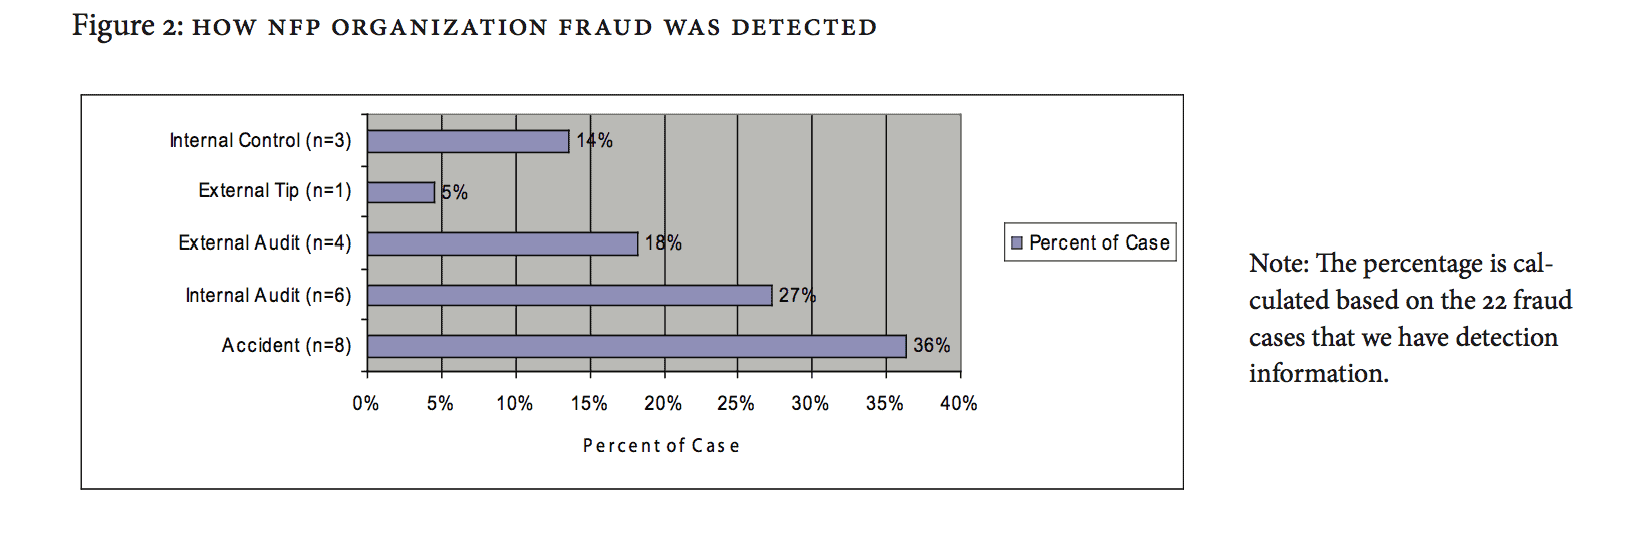
Of the 114 reported Canadian fraud cases we studied, only 22 described how the fraud was detected. Of these 22 cases, eight (36%) were detected by accident (e.g., a donor requested a receipt for the embezzled donation), six (27%) were detected by internal audit, four (18%) by external audit, one (5%) by external tip (i.e., from a bank), and three (14%) by other internal controls (e.g., by a board member; see Figure 2).
Characteristics of the defrauded nonprofit organizations
Type of organization
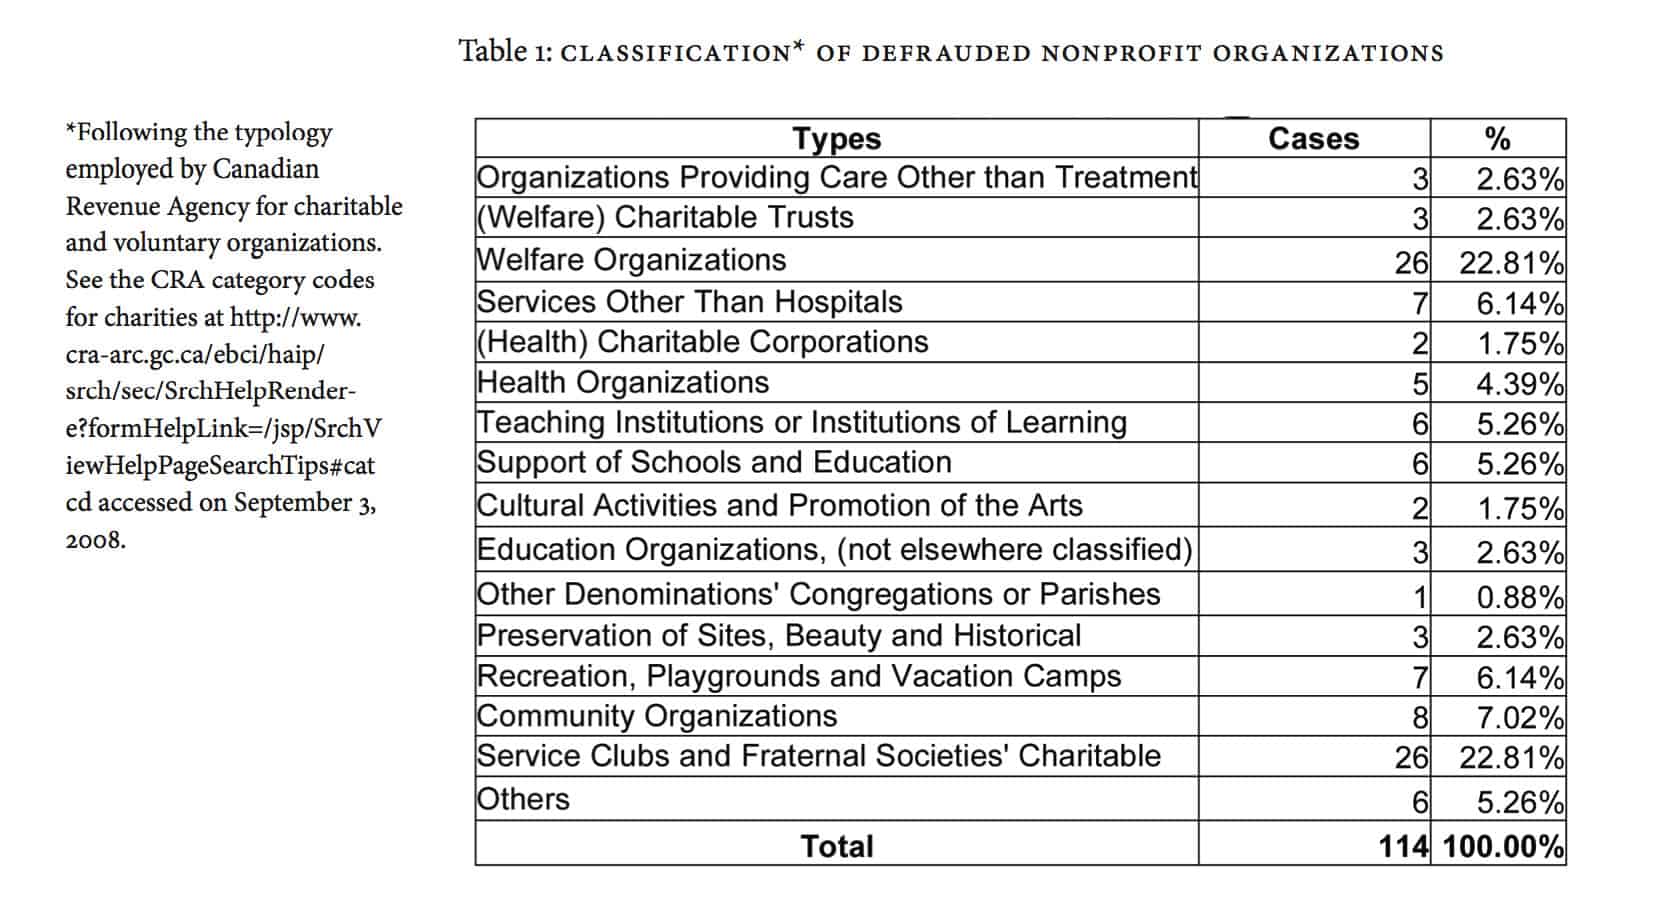
Of the 114 defrauded nonprofit organizations we studied, 44 were registered charities listed in the Canada Revenue Agency charities database (in other words, they
Following the typology employed by Canadian Revenue Agency for charitable and voluntary organizations. See the CRA category codes for charities at http://www. cra-arc.gc.ca/ebci/haip/ srch/sec/SrchHelpRendere?formHelpLink=/jsp/SrchV iewHelpPageSearchTips#cat cd accessed on September 3, 2008.
were able to issue charitable tax receipts). The remaining 70 organizations were voluntary organizations that fell into a variety of categories (see Table 1). The two types of organization that were most frequently victimized were welfare organizations, and service clubs and fraternal societies; each accounted for nearly 23% of our sample.
Size of the defrauded organization
Number of employees
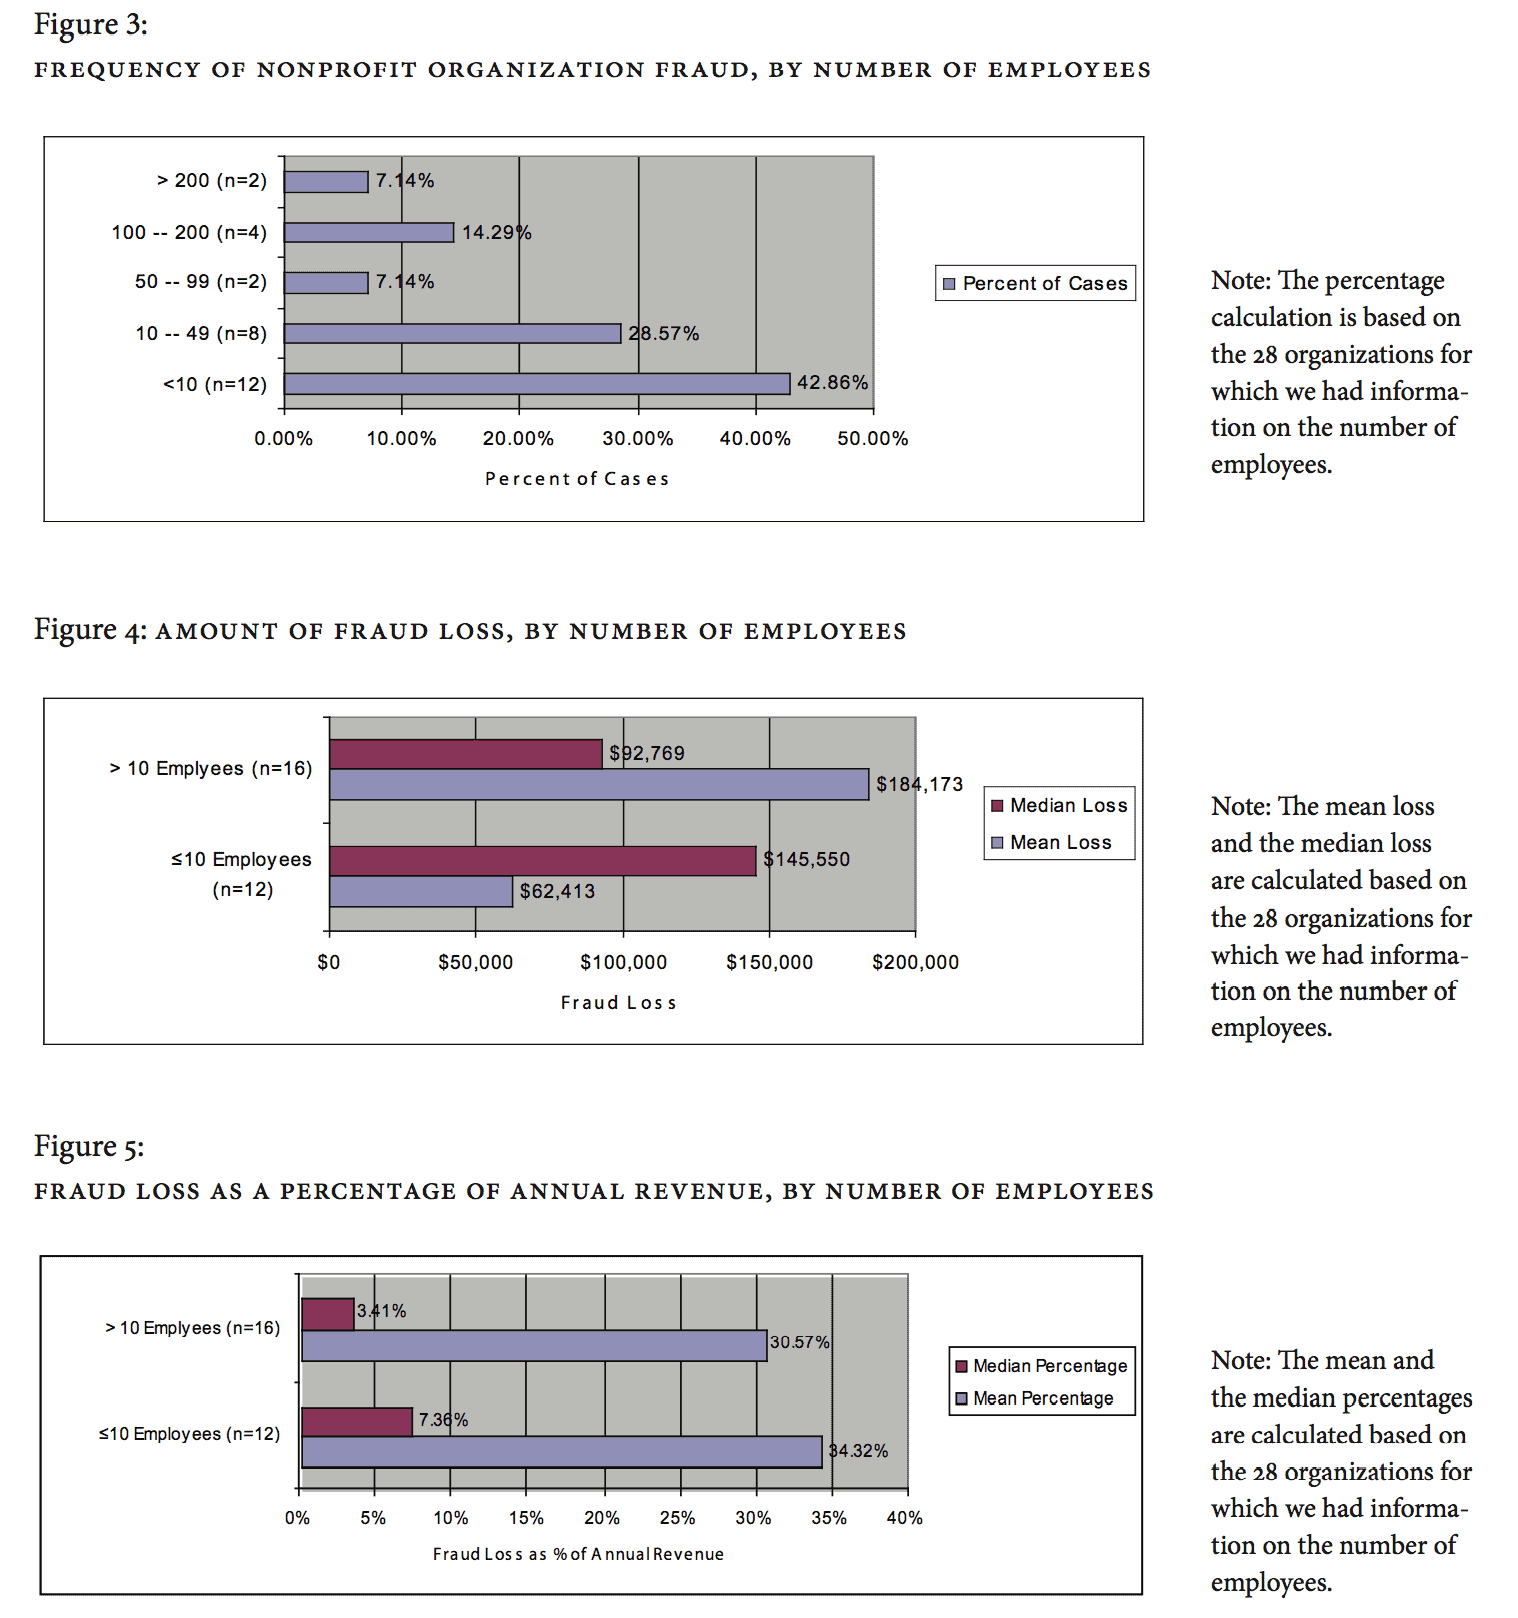
We used nonprofit organizations’ tax filings on the Canada Revenue Agency website and the organizations’ own websites to obtain the number of permanent, full-time, compensated employees, and part-time or part-year employees. We used the sum of full-time and part-time employees as one measure of size. Number of employees is important because one of the key principles of fraud prevention is segregation of duties. This is facilitated by a larger staff, which makes it more likely that the organization will have sufficient management and administration employees to effectively segregate asset custody duties, transaction authorization duties, and recording of transactions duties (the “Big Three” of segregation of duties). We could only locate 28 organizations that disclosed employee information. Of these 28 organizations, 42.86% (12 organizations) had fewer than 10 paid employees. Organizations with fewer than 10 employees and those with more than 10 employees had mean fraud loss $62,413 and $184,173 respectively, but these mean losses are not significantly different (p<0.143 ; see the Figure 3, 4, and 5 for more detailed analyses).
Annual revenues
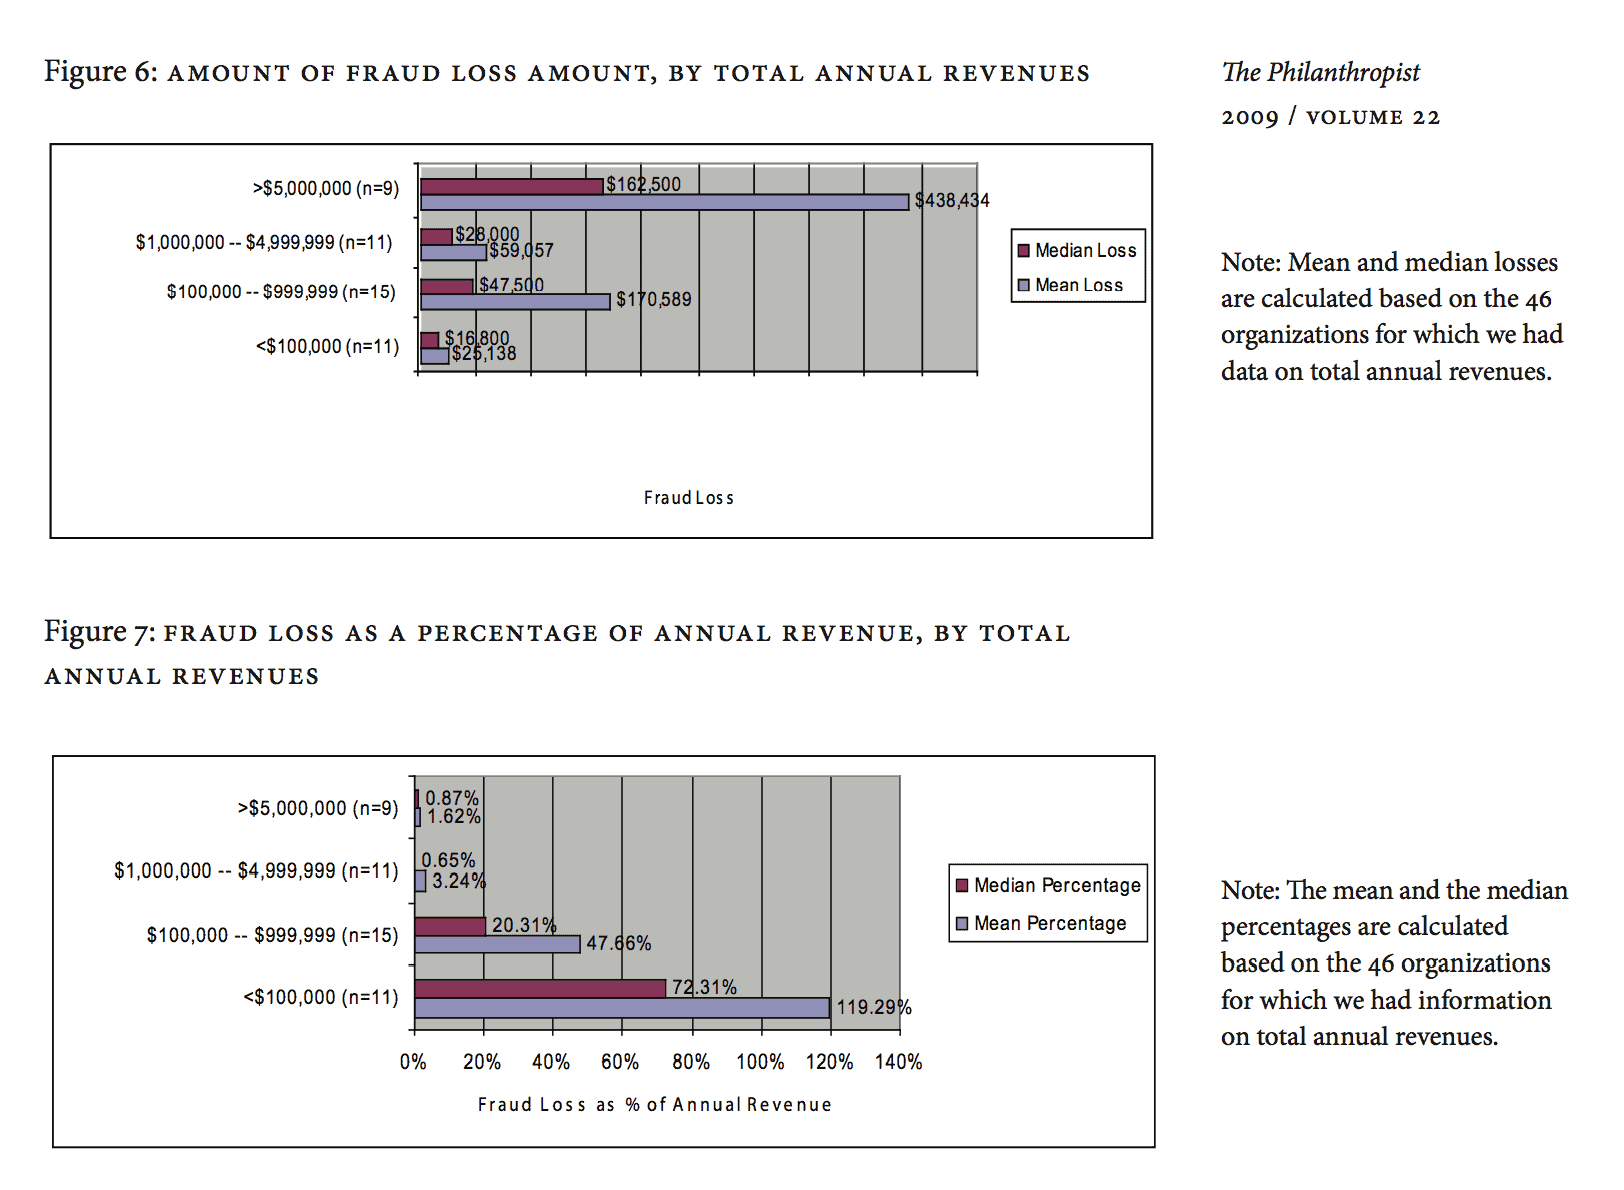
We found the latest annual revenues for 46 out of the 114 organizations on the Canada Revenue Agency website and nonprofit organizations’ websites. The mean annual revenue was $18,307,276; the median was $632, 252. The difference between the mean and median shows that a few large nonprofit organizations were defrauded but that small—er organizations were the typical focus of fraud. We examined revenue because larger organizations (i.e., those with larger annual revenues) would seem to have
greater resources to spend on fraud prevention and detection. We found that smaller organizations tended to have smaller absolute dollar fraud losses as compared to larger organizations (see Figure 6); however, these mean fraud losses were not significantly different from one other (see Table 2, Panel A, p<0.11). In terms of fraud loss as a percentage of annual revenue, smaller organizations tended to lose a larger percentage of their revenues through fraud, and larger organizations tended to lose a smaller percentage. The differences in mean percentages are statistically significantly different and demonstrate the relatively higher impact of fraud loss on smaller organizations despite the smaller absolute dollar amount involved (see Table 2, Panel B, p<0.02; and Figure 7).

Community size of defrauded nonprofit organizations
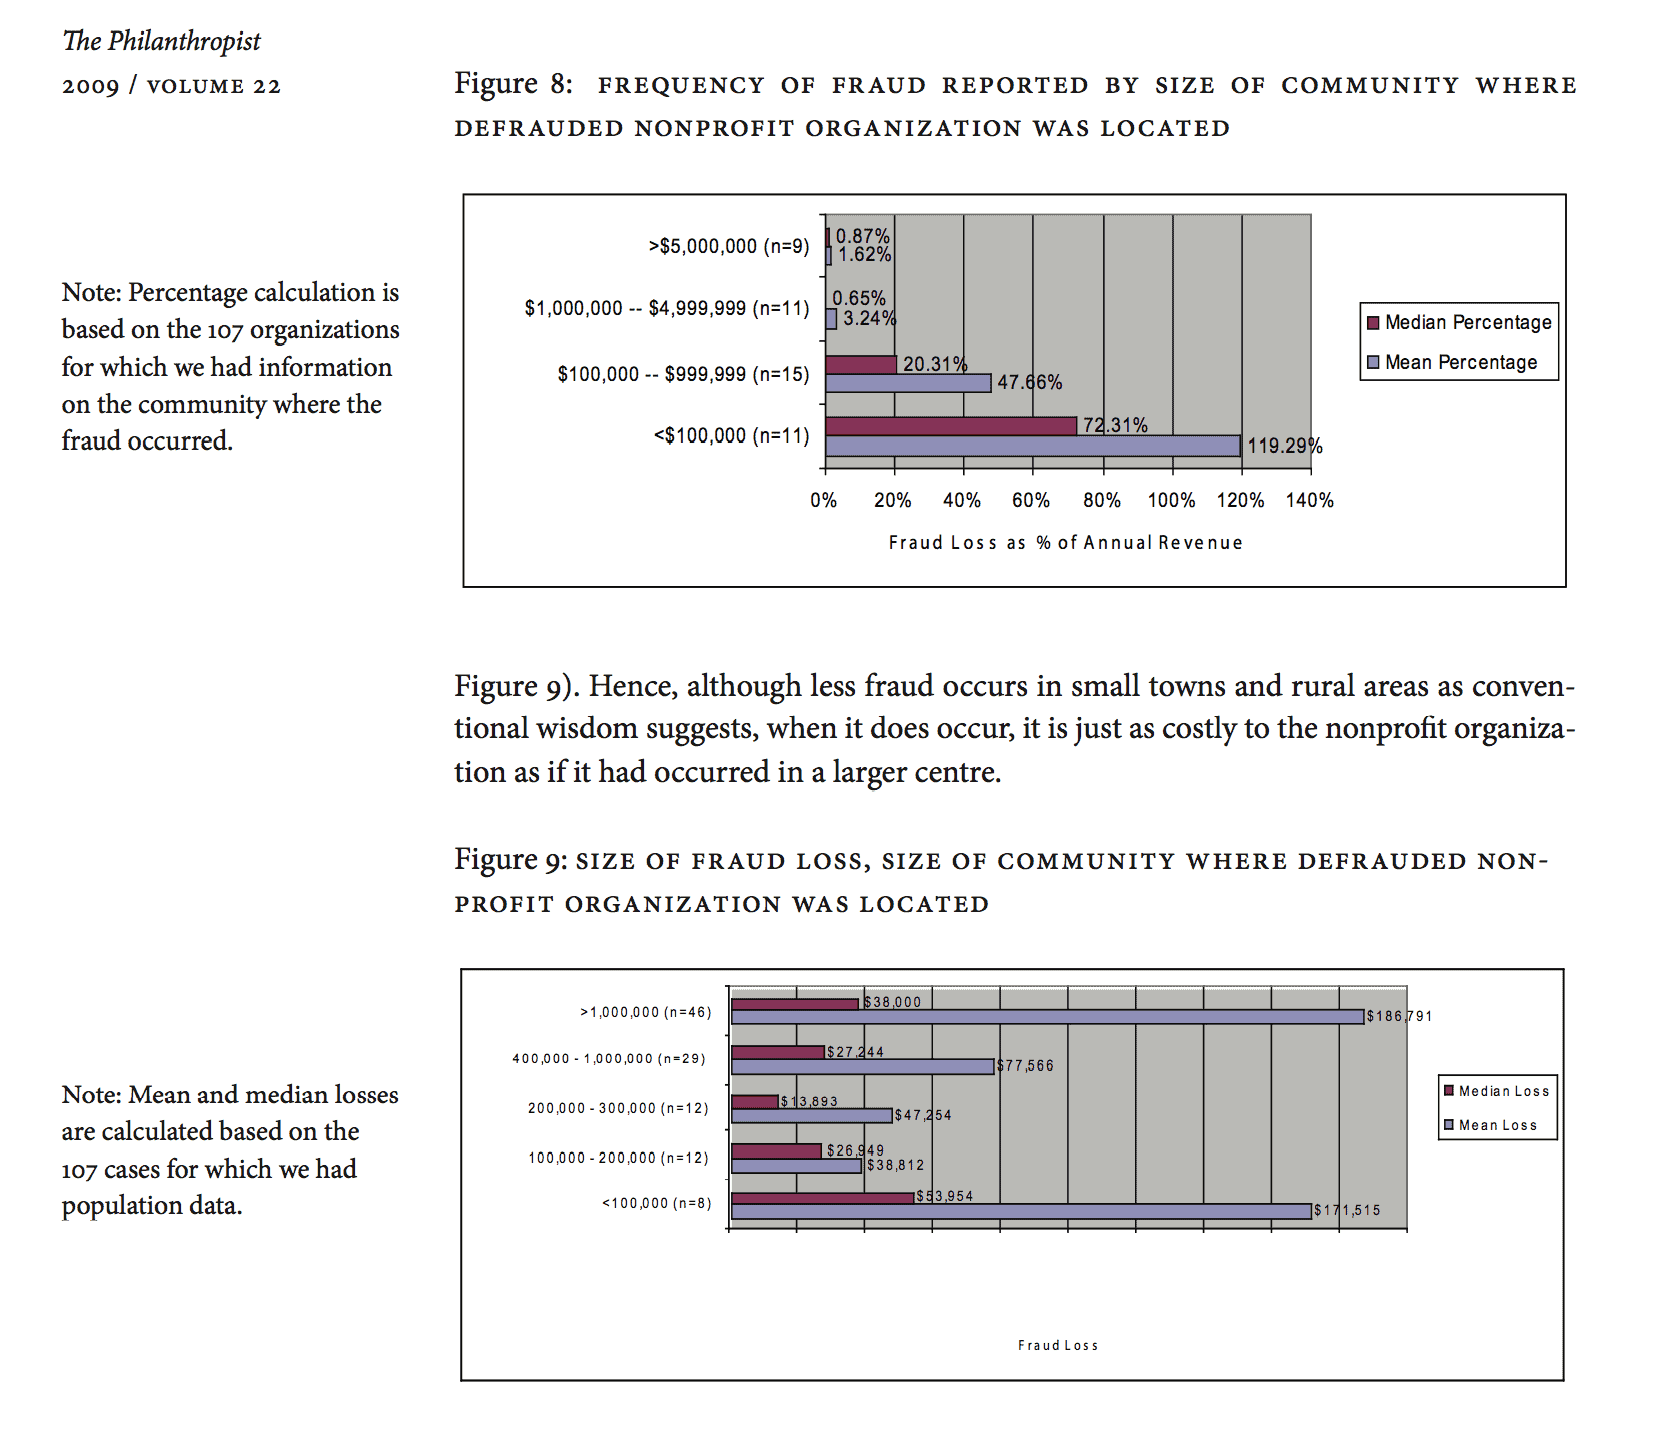
We identified the location of each defrauded nonprofit organization from news articles and then used the metropolitan population as a measure of the size of the community in which each defrauded nonprofit was located (see Figure 8). We used 2006 Statistics Canada definitions of census metropolitan areas for our population number (see Statistics Canada 2006 http://www12.statcan.ca/english/census06/release/index.cfm). Generally accepted wisdom is that in smaller towns and rural areas, people know each other better and are less likely to commit fraud as the social sanctions would be greater.
Of the 107 organizations for which news articles included location information, 42.99% were located in larger urban centres that had populations of more than one million. The mean community size was 1,033,246; the median was 892,712. We found that fraud was concentrated in the larger urban centres. For example, given the well know fact that 80% of Canadians live in urban areas (defined as population greater than 50,000) and 20% in rural areas (see Census, Statistics Canada, 2006), less than 8% of the reported fraud in our sample took place in communities with populations of less than 100,000.4
Moreover, defrauded nonprofit organizations located in larger centres with populations of more than one million lost the most (the mean fraud loss was $186,791), followed by organizations in the smallest communities with populations of less than 100,000 people (the mean fraud loss was $171,515). However, the mean fraud losses for
Characteristics of the fraud perpetrator
Collusion
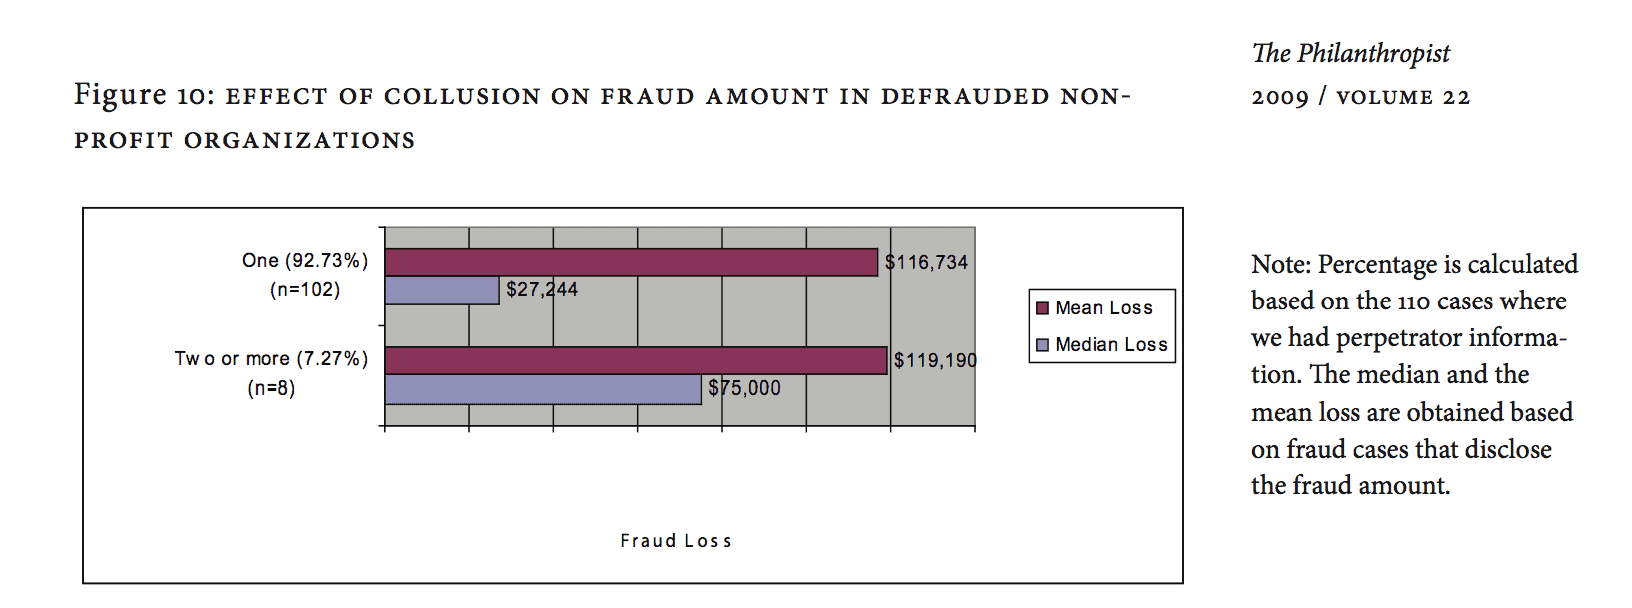
News articles on 110 of the 114 fraud cases in our study included information about the fraud perpetrators. A total of 118 perpetrators committed these 110 frauds. Of these frauds, eight (7.27%) were committed by collusion of two or more perpetrators, and the remaining 102 (92.73%) were committed by one perpetrator. This supports the story that fraud is more likely to be committed by a single individual; hence the need to segregate duties to make it difficult for one individual to defraud an organization on his or her own. The mean fraud loss was higher for collusion cases ($119,190, with a median of $75,000) but not significantly higher than the mean loss for sole-perpetrator cases ($116,734, with a median of $27,244; see Figure 10).
Perpetrator’s position in the nonprofit organization
News articles on all 114 fraud cases in our study included the position of the perpetrator.
We classified perpetrator positions into five categories: hired fundraiser, board members, CFO or financial staff, CEO or other managers, and other employees. The most frequently reported perpetrators were CEOs or other managers (29.82%), followed closely by CFOs or financial staff (28.07%), and hired fundraisers (28.07%). Fraud cases committed by CEO or other managers resulted in the highest mean losses ($176,082), followed by CFO or financial staff ($127,347), and other employees ($110,304). Frauds perpetrated by hired fundraisers resulted in smaller losses (a mean of $60,927), as did loses perpetrated by board members (a mean of $42,500). These mean fraud loss amounts, however, are not significantly different across the five categories (see Figure 11).

Perpetrator’s criminal background
News articles included 12 references to the criminal history of the 118 perpetrators; 11 of these references noted a prior criminal conviction. We were unable to determine if silence in the other 106 cases reflects lack of criminal record or just lack of reporting. We suspect, consistent with the media’s incentive to report if people charged with a criminal offense have a criminal record and a non-systematic review of reports of other criminal cases in the news media that we carried out, which consistently reported criminal records for cases where one might expect them to exist (i.e., theft, break and enter), that silence implies lack of a criminal record, suggesting that most nonprofit fraud is committed by those with no criminal record. Greenlee, Fischer, Gordon, and Keating (2007) report that most frauds committed within nonprofit U.S. organizations are perpetrated by individuals with no criminal record.
Perpetrator’s length associated with nonprofit organization
News articles on 13 of the 114 cases disclosed how long the perpetrators had worked with the defrauded organization. This ranged from one to 20 years, with a mean of 15 years and a median of 12 years and 7 months. Although this is a small sub-sample of the total number of cases we studied, it is consistent with U.S. evidence that nonprofit fraud is often committed by long-time, trustworthy staff and others at the highest levels in the organization (Greenlee et al., 2007).
Gender of perpetrator
As Figure 12 shows, 62 of the 118 perpetrators (53.91%) were male, and the remaining 53 perpetrators (46.09%) were female. This finding is in contrast to fraud literature in other jurisdictions, which reports males as the significantly dominant fraud perpetrator (PricewaterhouseCoopers, 2007; ACFE, 2008). Frauds committed by male perpetrators resulted in higher mean ($119,366.03) and lower median ($16,500) losses than those committed by female perpetrators (mean $108,778.17; median $40,000), but these differences are not significantly different.

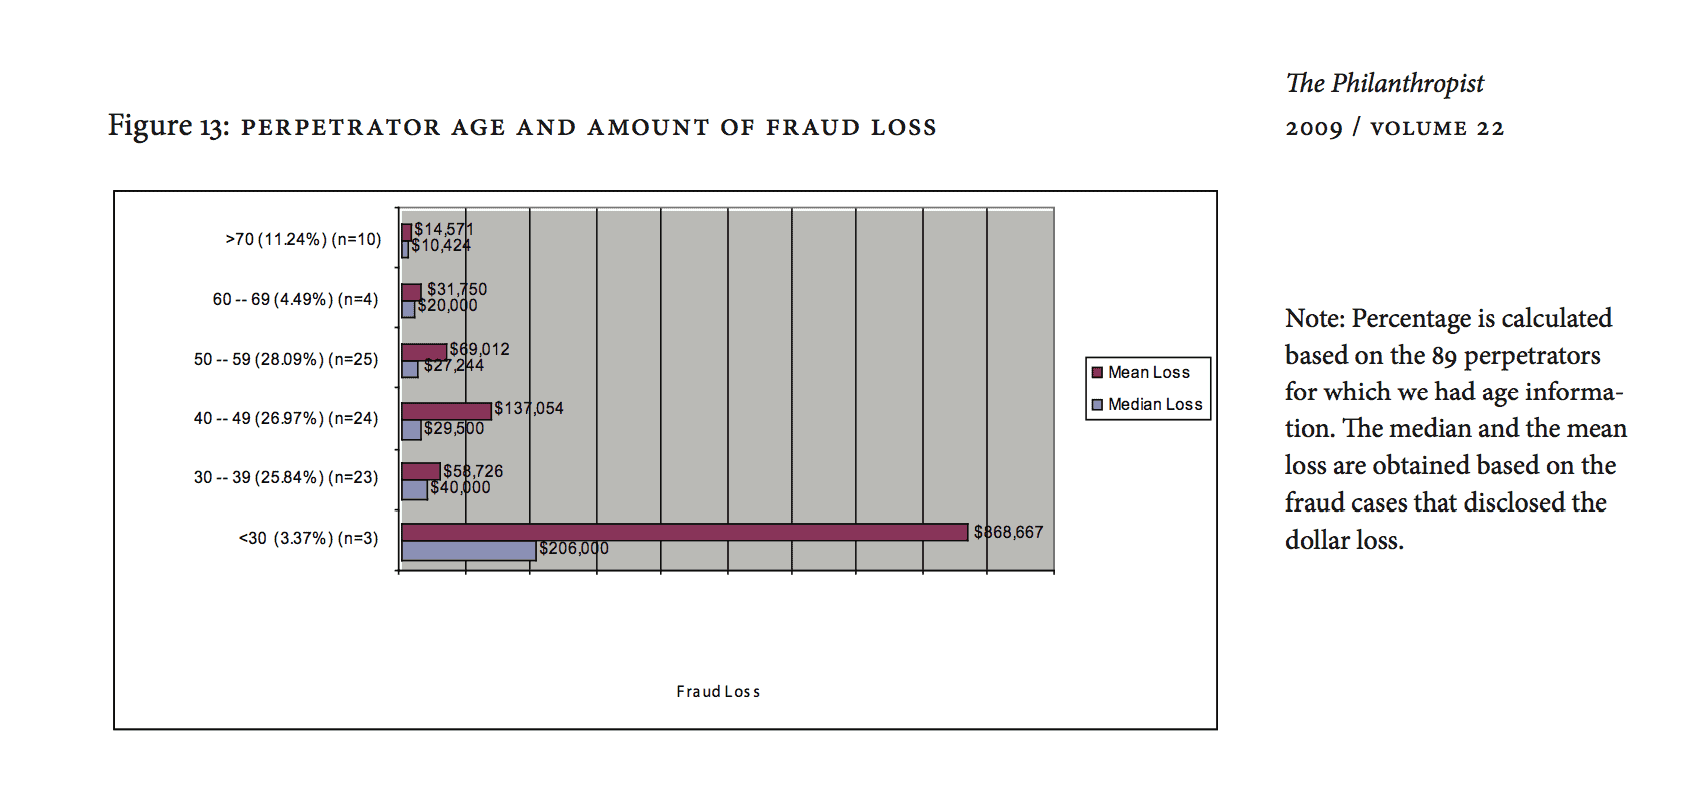
Age of perpetrator
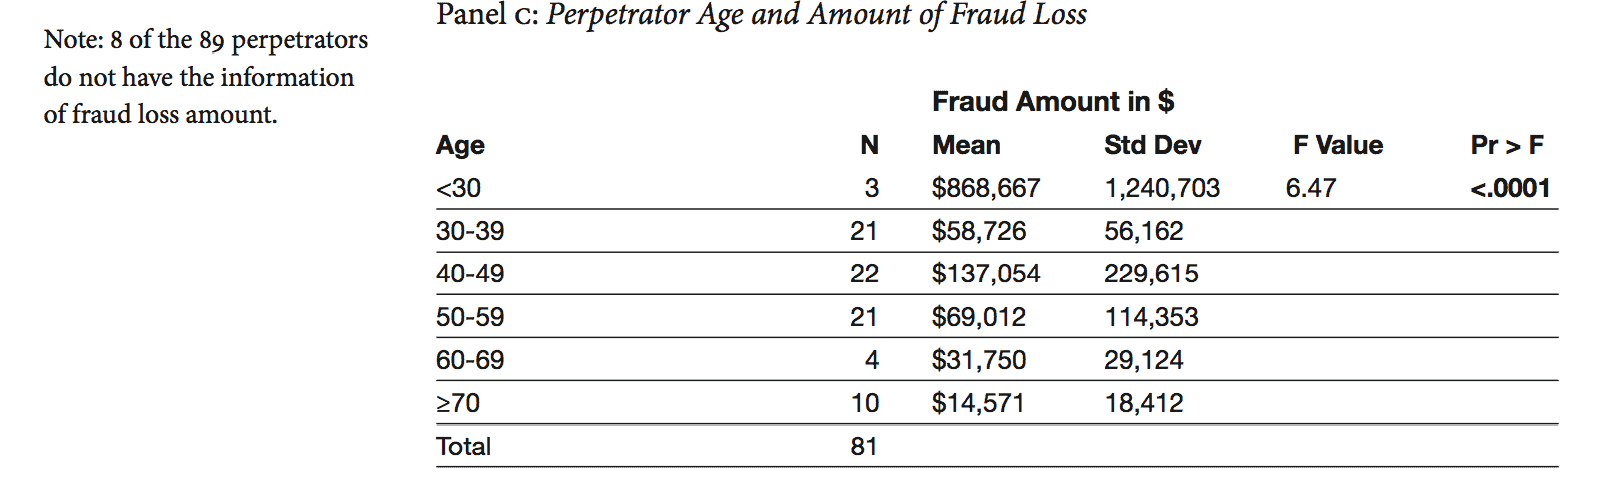
Figure 13 shows that in the 89 cases where the age of the perpetrator was given, the age ranged from 25 to 71, with both a mean and median of 48. The age ranges most frequently reported were 50-59 (28.09% of cases), 40-49 (26.97%), and 30-39 (25.84%). This finding is consistent with the finding that perpetrators were more likely to be long-time, trusted employees. However, when fraud was committed by perpetrators younger than age 30, the mean loss was $868,667, which is highly statistically significantly larger than the mean losses in other age groups (see Table 2, Panel C p<0.0001). Hence, while older individuals are more likely to commit fraud, due potentially to their better access and fewer controls over their activities, when younger people commit fraud, they tend to do so in a big way.
Case report date
In the 111 fraud cases in which we were able to tie a news report to the date the fraud actually occurred, we found that the first media report appeared at varying times after the fraud had been discovered. In all 111 cases, the report appeared at or after the perpetrators had been charged with crimes related to the frauds.5 However, in 52 cases (46.85%), the earliest press mention of the fraud was when perpetrators had been convicted of a fraud-related offense; in 58 cases (52.25%) the report is at the time charges were laid; and, in one case only when the person charged had been acquitted. There was no significant difference between high-level managers or board members (46.67%) and lower level employees (52.22%) being charged and convicted of fraud. We could find no record of the trial outcomes for 58 cases as at July 15, 2008, when our data collection ended, even though many of the stories dated back several years (see Figure 14).

Sentencing
Of the 52 cases in which the perpetrators were convicted of a fraud-related offence, the most common sentence was jail time (36 cases, or 69.23%), with average jail sentences of 32 months (ranging from 3 months to 90 months). The second most common sentence was probation, meted out in 14 (26.92%) cases although in 5 of these 14 cases, probation was in addition to jail time. The third most common sentence was house arrest (7 cases, or 13.46%), with two cases of these 7 cases house arrest being in addition to jail time. Finally, four perpetrators received conditional sentences involving no jail time, one received a suspended sentence, and one received a $1,000 fine.
Summary
What does this study tell us about the nature of nonprofit organizational fraud in Canada? We summarize what we learned from three perspectives.
The fraud itself
Fraud at nonprofit organizations tends to be small in terms of the absolute dollar amount, with a few very large frauds committed at generally larger nonprofit organizations. However, while small in terms of the dollar amount of the loss, frauds in smaller nonprofit organizations can represent a huge portion of annual revenues; in organizations with less than $100,000 in revenues, the median fraud loss represents over 70% of revenues. Fraud is most likely to be detected by some form of internal control (e.g., an internal audit) or by accident, with external audit leading to some discoveries (we do not know how many of the organizations in our study were audited, so the audit contribution could be much higher as a percentage of organizations audited).
The defrauded nonprofit organization
Perhaps not surprisingly, fraud was more likely to occur in large urban centres than in smaller centres. For example, almost 82% of the reported frauds were committed in census metropolitan areas of 200,000 or more, which represents 60% of Canada’s population as of the 2006 Census. Nonetheless, both the largest and smallest centres reported similar average fraud losses. With limited data, we observed that larger organizations (measured either by number of employees or by annual revenue) did not seem to experience a lower frequency of fraud, giving credence to the story that good internal control does not depend solely on organization size but also on attitudes towards control. Organizations that had strong internal controls and annual external audits tended to discover frauds themselves, while other organizations found fraud by accident or by tips, which cannot be relied on as a consistent means of fraud detection.
The fraud perpetrator
The most frequently reported fraud perpetrators held senior management positions such as CEO, CFO, or other managerial and financial positions in the nonprofit organization, worked for the organization for more than 10 years, and were between the ages of 30 and
50. Although senior people might be more able and motivated to commit fraud, younger people who commit fraud tend to defraud organizations of much larger amounts.
The majority of fraud cases were committed by one perpetrator rather than by collusion of two or more perpetrators. The ability of one person to steal significant sums of money reveals an ongoing weakness in internal controls and an emphasis on “trust” rather than ‘trust but verify,” a much safer approach.
Assuming the news media’s lack of mention of criminal background in their reports implies a clean criminal record, the vast majority of perpetrators in the cases we studied did not have a criminal record. The number of male and female perpetrators was roughly equal, as was the size of the fraud perpetrated by each gender.
Finally, fraud perpetrators who are charged and convicted of a criminal offence do not fit the general societal image of the white-collar criminal who walks away with a “slap on the wrist”; most receive at least some jail time.
Conclusion
Our study collected news reports of frauds in Canadian nonprofit organizations that were committed by individuals associated with the organization, be it a staff member up to the level of CEO, a board member, or a hired contractor such as a fundraiser. Combining the information in newspaper articles with that available to the public in the Canada Revenue Agency charity database and nonprofit organization websites, we investigated frauds in Canadian nonprofit organizations from three perspectives: the fraud itself, the organization defrauded, and perpetrator. This study is the first in Canada to attempt to document the scope, severity, and other characteristics of Canadian nonprofit fraud from publicly available sources. Although the newspaper articles can have a selection bias (i.e., they may report only on frauds where criminal charges are laid), we believe this is the first step to learning more about Canadian nonprofit frauds.
Some may find the concept of fraud within nonprofit organizations unthinkable. How could someone cheat or steal from an organization that is dedicated to helping others? This study provides evidence that fraud does not discriminate. Smaller Canadian nonprofits appear especially vulnerable. These organizations in particular might consider the following fraud-prevention strategies: 1) develop stronger oversight, especially where standard internal controls such as segregation of duties are difficult to implement, 2) institute a whistle-blowing or tip hotline, 3) ensure the organization maintains an ethical culture in which top management and the board not only “talk the talk” but “walk the walk.” Armed with increased awareness of the risk of fraud, we can analyze the causes in greater depth and develop new and better methods for detecting and deterring fraud.
Appendix
The full list of search terms used to search news articles in the database “Canadian Newsstand.”
The words defining the nature of organizations: Nonprofit, Non-profit, Not for profit, Charity, Charitable, Volunteer, Volunteering, Volunteerism, Fundraise, Fundraising, Fundraiser, Club, Association, Culture, Cultural, Religious, Religion, Church.
The words related to frauds: Fraud, Fraudulent, Theft, Crime, Criminal, Scam, Steal, Stolen, Stole, Extortion, Extort, Dishonest, Dishonesty, Forge, Forgery, Bamboozle, Bamboozlement
Wildcard searches: We used wild card search terms for the following. The “*” indicates every possible set of letters that could appear at the end of the word.
Organization: Chari*, Volunt*, Fundrais*, Cultur*
Fraud: Fraud*, Crim*, Stole*, Extort*, Dishonest*, Forge*, Bamboozle*
Acknowledgements
The authors would like to acknowledge the valuable research assistance of Laura Gilchrist and to thank the CA- Queen’s Centre for Governance Not-for-Profit Initiative for funding their study.
References
Association of Certified Fraud Examiners. (2008). 2008 ACFE report to the nation on occupational fraud & abuse. URL:http://acfe.com/resources/publications.asp?copy=rttn [August 20, 2008]. Canada Revenue Agency. (2008). Category codes.
URL: http://www.cra-arc.gc.ca/ebci/haip/srch/sec/SrchHelpRender-e?formHelpLink=/jsp/SrchViewHelpPageSearchTips#catcd [September 3, 2008].
Greenlee, J., Fischer, M., Gordon, T., & Keating, E. (2007). An investigation of fraud in Nonprofit organizations: Occurrences and deterrents. Nonprofit and Voluntary Sector Quarterly 36: 676-694.
Hall, M., Barr, C., Easwaramoorthy, M., Sokolowski, S., & Salamon, L. (2005). The Canadian nonprofit and voluntary sector in comparative perspective. Imagine Canada: 1-39. Fremont-Smith, R., & Kosaras, A. (2003). Wrongdoing by officers and directors of charities: A survey of press reports 1995-2002. Exempt Organization Tax Review 42 (October): 25-36.
PricewaterhouseCoopers. (2007). Global economic crime survey 2007. Statistics Canada. (2006). 2006 census: Release topics and dates.
URL: http://www12.statcan.ca/english/census06/release/index.cfm [September 2, 2008].
Notes
1 We use both median and mean numbers in this article. The median is the halfway point in a set of values. In this case, half the organizations with revenues of $100,000 or less lost less than 72% of their revenues through fraud and half lost more than 72%. The mean is the average of a set of values.
2 To calculate this percentage, we used the latest annual revenue amount that we found either in the Canada Revenue Agency database for charities or in the relevant organization’s website. We used this figure because it was difficult to find annual revenue figures for organizations affected by fraud in the earlier years covered by our study; Canada Revenue Agency provides the tax filing data only for 2000 and later, and organizations’ websites usually only contain financial data for the two prior years.
3 We use the term “statistically significant” to mean a highly likely-to-be-meaningful difference at probability of 0.05 or 1 time out of 20. We use the term “marginally significant” to mean a probability of 0.10 or 1 time in 10. Table 2 presents the relevant ANOVA tables for any significant or marginally significant results.
4 This could be biased by our choice of Canadian Newsstand as a search source, but we found no additional articles when we searched a Canadian database that concentrates on regional papers in Ontario and Quebec (Newsscan.com).
5 This might explain the press publication and hence bias our results. The most common charges laid in court under the Criminal Code reported by the news media were “theft over $X” or “fraud over $X,” with the rarer charge being “falsification of books and records.”
keywords Fraud, Nonprofit, Voluntary sector, Nonprofit organization
Qiu Chen, Steven Salterio, & Pamela Murphy
Queen’s University, Kingston, Ontario
Qui Chen, M.Sc., is a Doctoral candidate at the School of Business, Queen’s University, Kingston, Ontario.
Steven Salterio, Ph.D., FCA, is the Pricewaterhouse-Coopers/Tom O’Neil Faculty Fellow in Accounting, Professor of Business, and Director, CA-Queen’s Centre for Governance, Queen’s University, Kingston, Ontario.
Pamel a Murphy, Ph.D., CPA, is Assistant Professor at the School of Business, Queen’s University, Kingston.