The Lessons Learned From The Voluntary Sector Reporting Awards For Excellence In Financial Reporting Transparency
Information about the Voluntary Sector Awards Program and entry information can be found at http://business.queensu.ca/centres/CA-QCG/ voluntary_sector_reporting/ index.php .
A professor at one of Canada’s leading universities wanted to use a set of financial statements from a not-for-profit organization in class as an example for new Canadians interested in joining charities’ boards of directors. He wished to use a local example and therefore went to the website of a prominent national charity that was headquartered in that city. He found a full colour glossy “annual report,” but it contained no accounting information and little in the way of accountability in terms of how the funds raised were used. The website stated that audited financial statements were available on request and, using the email address provided, he requested them. Several weeks passed, and he prompted them again for a copy of the financial statements because of his time constraints. A vice president of the organization called him and asked what he “really” wanted with the financial statements. After some discussion the statements were provided under the proviso that they be used only for the course.
The nonprofit sector in Canada is large and very diverse, ranging from religious organizations, to sport clubs, to cultural organizations of all types and sizes. According to a recent survey (Statistics Canada, 2004, pp. 9-21) there were over 160,000 nonprofit and voluntary organizations in Canada in 2003, 56 percent of which were registered charities. Yet obtaining information about these organizations can be a daunting task. Research has shown that the information filed with the Canada Revenue Agency (Form T3310) and made public on the CRA website is often incomplete, inaccurate, and not internally consistent (Ayer, Hall, & Voderak, 2009). The low quality of this information, the only mandatory information required to be released by government regulation, makes organizations’ annual reports and audited financial statements that are voluntarily provided (note: in some provinces audited financial statements are required) even more important in order for organizations to be transparent and accountable to the donating public.
Canadians believe that charities need to be transparent and accountable, as exhibited by their responses in the Muttart Foundation report Talking About Charities (2008). This report documents that nearly 100% of respondents surveyed believe that it is important for charities to provide information about their programs and services, the use of donations, the impact of their work, and their fundraising costs. The same research revealed a huge information gap about how well charities are doing at providing accurate information. Respondents believe that charities are “excellent or good” in providing information about programs and services 51 percent of the time, even though reporting about “use of funds” and “the impact and fundraising costs” are judged to be well done only 26 and 38 percent of the time respectively. As our opening story illustrates and these statistics confirm, there is clearly room for improvement in charities’ accountability and transparency.
Best practices for financial reporting transparency in the private sector are highlighted in several awards programs (e.g., the Canadian Institute of Chartered Accountants Annual Report Excellence Awards; CICA 2006, 2007a, 2007b). These awards have been expanded to highlight excellence in Crown Corporation reporting; however, there were no equivalent awards in the broader not-for-profit sector. Hence, it was difficult for organizations that wanted to improve the transparency of their reporting to find best practice examples to follow. In 2007, the CA-Queen’s Centre for Governance proposed to highlight best practices in financial reporting transparency by staging a competition among voluntary sector organizations headquartered in Ontario.1 The Centre focused on charities that were not in the MUSH (municipalities, universities, school boards, and hospitals) sector, due to the fact that MUSH organizations are subject to great scrutiny from a variety of parties, including various government agencies (see for example, Nelson Banks and Fisher (2003) on universities’ reporting transparency).
This report focuses on the lessons learned from the 2008 and 2009 Voluntary Sector Reporting Awards (VSRA) competitions. We focus on areas that need the most improvement, but rather than putting a negative emphasis on organizations with poor practices, we call attention to organizations that have developed what we consider best practices in the areas where common problems were found.
In this article, we briefly introduce our technical scoring system to highlight the areas that we feel make up the features of an accountable and transparent annual report by a voluntary sector organization. We then report on common problems and, where possible, give examples of organizations that deal with the issues well, as a means to encourage other organizations to improve. Finally, we highlight some areas that we consider at the cutting edge of best practices that should be emulated by all organizations.
Developing the VSRA program and its technical scoring index
The goals of the VSRA program are twofold. First, the program provides the opportunity to award both recognition and a monetary reward ($5,000) to organizations that demonstrate a commitment to accountability and transparency. Second, and equally important, it provides the opportunity for organizations to receive feedback in order to improve their reporting in the future. To facilitate the feedback process, we followed a generally accepted procedure for developing indices (Coy & Dixon, 2004) to arrive at a standard scoring approach for the annual reports. See Table 1 for the six step process we followed.2
table 1: The six-step model of index development used in developing the VSRA Annual Report Scoring Index
1. Identifying The Objectives Of Reporting For The Sector Of Interest
• Objectives of financial reporting are clearly outlined in accounting standards which apply to voluntary reporting organizations.
• Objectives of annual reports for voluntary organizations are developed from
Canadian voluntary sector field research commissioned by the Centre (Gill, 2008) and from extensive literature searches and comparisons to objectives of other competitions.
2. Reviewing Contemporary Reporting In The Sector Of Interest
• Done via an extensive literature search supplemented by extensive web-based searches.
3. Determining The Objectives Of The Index
• To obtain ability to measure the relative commitment to accountability and transparency by not-for-profit organizations as demonstrated in their annual reports and audited financial statements.
• To have an index that is clear and concise so as to be able to provide feedback to individual organizations partaking in the contest to help them understand more easily the areas for improvement.
4. Identifying The Appropriate Disclosure Of Items And Report Qualitative Characteristics
• The items selected were based on prior judging criteria in similar competitions (United Kingdom, Australia, and Netherlands), national and international reporting standards, and best practices articles discovered in our literature review (see Table 2).
5. Obtaining Appropriate Stakeholder Validation Of Index Items
• CA-Queen’s Centre for Governance commissioned a focus group of funders that provide indirect support of the index items importance and relevance to that subgroup of stakeholders (see Gill, 2008). Many of the items selected have been utilized in one form or another in other reporting awards (see Table 2).
6. Testing And Revising The Index
• Extensive internal testing on non-Ontario charity annual reports.
• Revisions made to enhance usability and consistency of application of the scoring schema across five different coders with different academic background, although all in business.
Source: Drawn from Coy and Dixon (2004), adapted for the VSRA Index development process.
First, we searched extensively for competitions of this type around the world (e.g., Charities Awards in the UK; see www.charityawards.co.uk) and looked at organizations that evaluate not-for-profit disclosures (e.g., Intelligent Giving; see www.intelligentgiving. com.). As our objective is to encourage transparency and accountability by not-for-prof—it organizations to their various stakeholders, we looked for commonalities in criteria employed across different competitions. We adapted those criteria to the Canadian setting when necessary. Table 2 provides a comprehensive list of sources that we relied on in developing on our criteria.
Table 2: Selected sources of evaluation criteria
• Charity Awards—Various years. See www.charityawards.co.uk
• Charity Commission for England and Wales. Accounting and Reporting by
Charities: Statement of Recommended Practice Revised (2005)
• Charity Commission for England and Wales. Transparency and Accountability
RS8 (2004)
• PricewaterhouseCoopers—Netherlands. Evaluation criteria for the 2006 transparency award (2006)
• Western Australian Parliament. Public Sector Annual Report Framework (2006)
• PricewaterhouseCoopers—Australia. Transparency Awards (2006)
• CICA. Corporate Reporting Awards Judging Criteria (2007)
• CICA. CICA Handbook series 4400
• Legislative requirements for Ontario incorporated charities. See www.sse.gov.on.ca/mcs/en/pages/
• Regulations of the Canada Revenue Agency. See www.cra-arc.gc.ca/chrts-gvng/menu-eng.html
• Intelligent Giving. 2008. Our plans for the future. www.intelligentgiving.com
• A comprehensive review of the academic literature on transparency of annual reports in both the public and private sectors (available from first author)
Second, we used weights for the various criteria based on similar competitions held around the world. We developed the final category weights in Table 3 based on the consensus view of two independent researchers who reviewed the literature identified in Table 2 and considered what adjustments needed be made for the Canadian setting.
Table 3: Categories evaluated and associated category weights used in VSRA technical scoring process

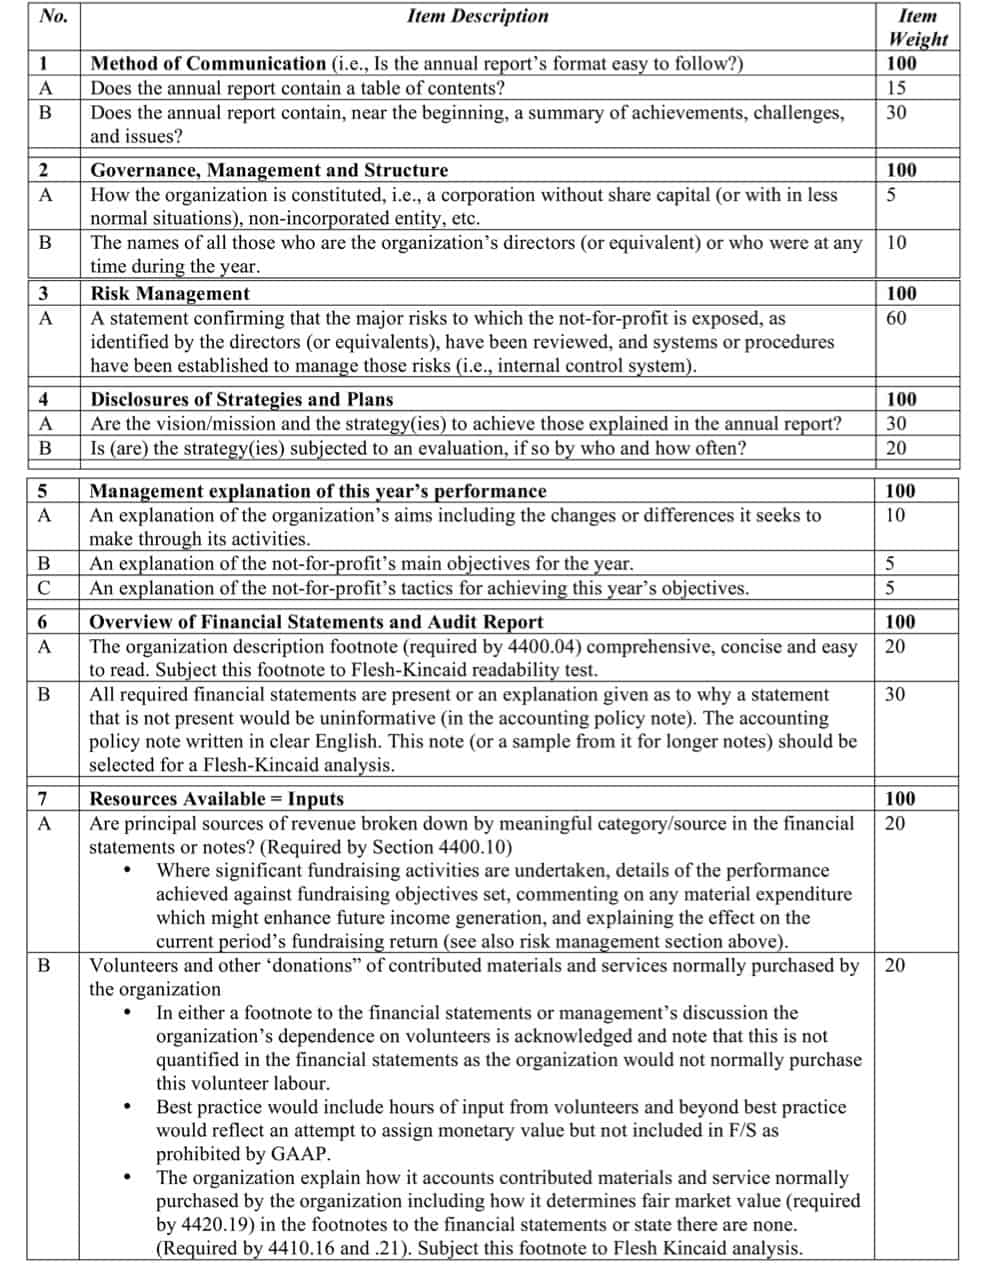
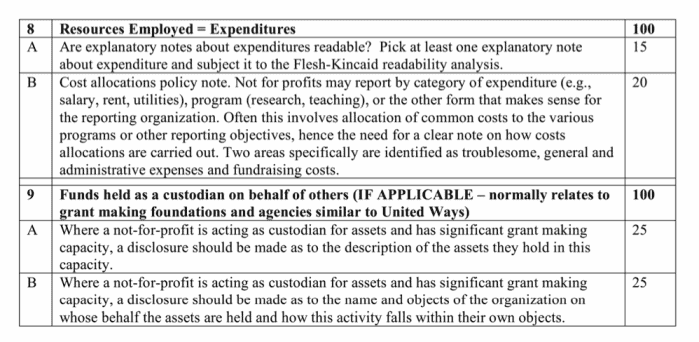
Third, the individual items to be scored were largely drawn from other similar competitions (see Table 2 for list of sources) for charitable reporting and follow the same process of selection. For examples of the individual items within categories that were scored, see Table 4. While the same scoring template was used for all organizations, organizations of different sizes are scored together in a systematic fashion to limit the effects on scoring that might occur if organizations with radically different resources were scored at the same time.
HOW WE ACCOUNT
TABLE 4
Note: Consistent with the overall schema, if an item is not applicable, the points are divided proportionally among the remaining items within the category. Hence, companies are not penalized for items that are not applicable.
table 4: Examples of items scored within each category and associated item weight
(items in categories do not add to 100 due to illustrative nature of items listed) continued
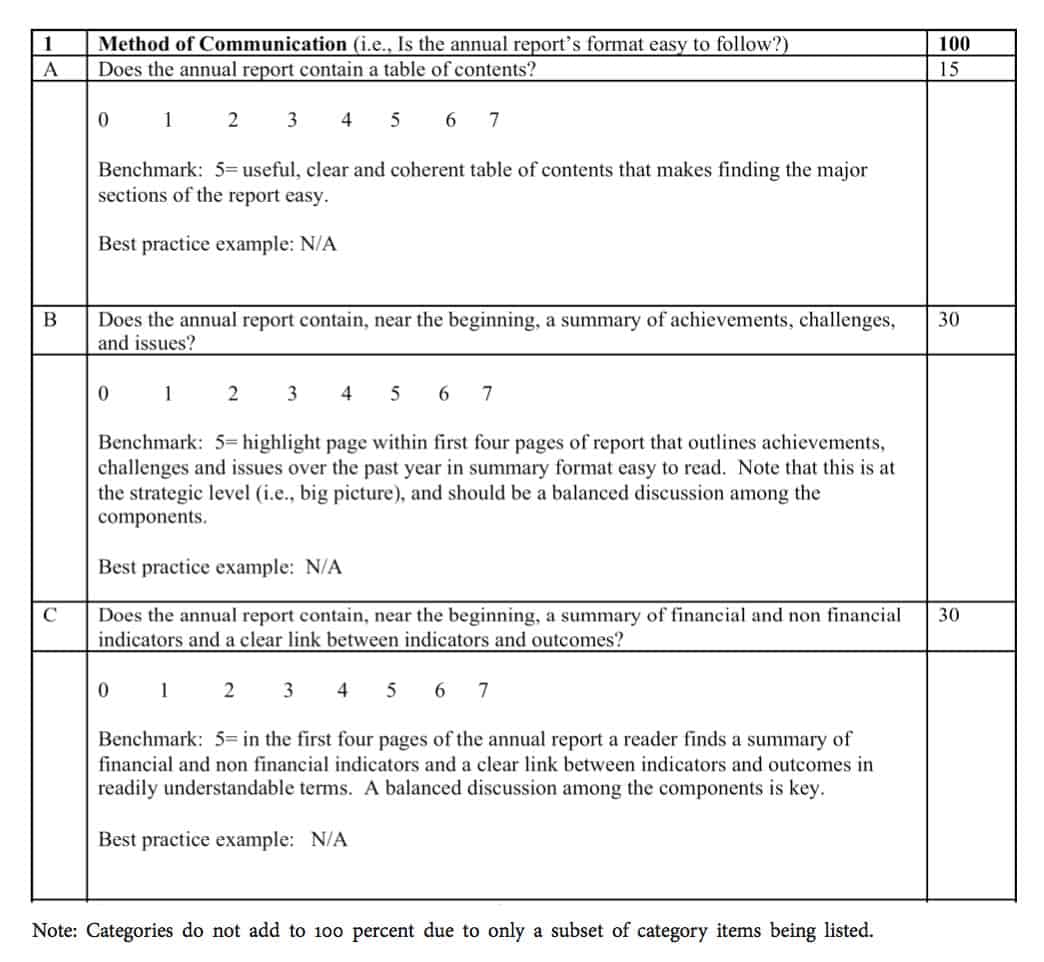
Fourth, we developed a scoring system that is easy to apply from the technical scorer’s viewpoint, leading to high consistency between different technical scorers. Further, the scoring system needed to be easily understood by organizations receiving the feedback. We used, consistent with other organizations’ approaches to scoring (e.g., Transparency Award, Netherlands), continuous measures (as opposed to present/absent judgments) to differentiate quality of the reporting. We adopted the approach of developing a single benchmark criterion (assigned a score of 5) for each item scored and then evaluated individual organizations’ disclosures against the standard benchmark (e.g., see Coy & Dixon, 2004). In situations where the organization failed to achieve the benchmark (benchmark=5), the score would be in the range of 0 to 4, with lower scores indicating lower quality reporting. When the organization performed above the benchmark, the score would be greater than or equal to 6, with higher scores signifying that disclosures exceeded our benchmark. This approach allowed the technical scorers to utilize judgment in their scores and contrast disclosures between organizations rather than being constrained by the rigid scale criterion. Further, an organization could see which areas of its reporting were considered to be below or above the clearly stated “benchmark.” See Table 5 for examples of the scoring scale.
table 5: Example of the scoring scale used
The main weakness in the index development process is that we did not independently validate that it measured what it purports to measure, that is, the quality of voluntary sector organizations’ reporting. However, over half of the organizations in the first year of the awards submitted their substantially changed reports to the second competition, giving us indirect feedback that they felt the competition gave them a better understanding of how to make their reporting more transparent and accountable.
Judging process
The technical screening was carried out by three chartered accountants, a doctoral student in accounting, and several audit juniors (entry level CA students) recently graduated from Queen’s University. All screeners received extensive training in the use of our coding scheme (Tables 3, 4, and 5), their independent scorings were cross checked 100% at least once, and a large sample (approximately 25%) of the organizations’ scores were reviewed for a second time. The top three or four reports (depending on the proximity of the fourth report’s score to the third’s in technical screening) in each of the four categories were forwarded to the seven-member Judges’ Panel for judging on a broader more holistic perspective leading to the selection of award winners in each category.
Each judge spent at least 30 hours in preparation for an all-day meeting where the reports were judged. The Judging Panels were composed of a philanthropist, a marketing expert, and a representative of the broader not-for-profit sector advocacy groups. Accountants were represented by a senior Assistant Auditor General from the Office of the Audit General of Canada, a retired Fellow of the Institute of Chartered Accountants who was renowned for both his participation in judging for-profit annual report competitions (e.g., the CICA Excellence in Reporting Awards; CICA 2006, 2007b) and for his interest in the not-for-profit sector, and an accounting academic who carried out research in the not-for-profit area.3 In all cases, none of the charities that the judges (or the technical screeners) had been associated with were involved in the competition.
Common problems
In this section of the report, we comment on eight common problems identified in technical screening and the finalists judging round. Where possible, we identify annual reports that have successfully dealt with this problem.
problem 1: Not providing a strong introduction so a reader can size up an organization quickly
To orient the reader and enhance accessibility, the annual report should provide a concise executive summary of the year’s operations. This summary should use tools such as short text, graphical illustrations, bullet points, and clear, concise paragraphs. Within the first four pages of the annual report, readers should be able to answer the following questions:
1. What is the vision/mission/purpose of this organization?
2. What is its strategy to achieve its vision/mission/purpose?
3. What was its objective this year? What did it hope to accomplish?
4. What were some of its financial and non-financial highlights during the year?
5. What were its achievements, challenges, issues, and risks?
6. What is the organization’s plan moving forward? What does it hope to accomplish next year?
Answers to these questions enable readers to orient themselves to the organization and what it does.
Furthermore, the annual report should also have a table of contents, include numbered pages, and be clearly organized. For example, in the award-winning United Way of Greater Toronto’s 2008 Annual Report, the report’s five sections, each with its own oneword theme, was seen by the judges as a very clear and transparent way to structure the report. However, the table of contents needed to be improved so that the judges could use this excellent structure.
problem 2: Lack of stated performance objectives and targets
Most annual reports did not explicitly state their organizations’ financial and non-financial performance indicators and objectives. Hence, readers are unable to assess the performance of organizations both in the current year and in relation to their multi-year strategic plan (which also was not often disclosed, although alluded to). The reader is unable to answer questions such as: How effective are the organization’s fundraising efforts? Did its program outcomes meet its goals? How many people did the organization help this year, and did it meet their targets? 2a. w h erearethebudget s?
It was extremely rare for annual reports to contain a budget. Yet it is virtually impossible for the reader to assess the financial performance of the organization without this tool. It is equally difficult for management to comment on an organization’s financial performance during the year without a budget as the barometer for the analysis. The United Way of Greater Toronto, in its 2009 report, provides some detailed qualitative discussion about its actual-to-budget comparisons, albeit without many numbers.
The budget is the financial tool that most organizations use to identify the programs and activities to fund and to help control expenses. It is also a tool the board can use to evaluate management’s performance. The budget enables the organization to create a link between its financial resources and strategy. It is a basic financial benchmark tool used to assess how the organization’s actual results compare to the plan. The budget should be a key planning tool for the organization, and the reader should be provided with the budget, along with a discussion and analysis of budget to actual results. Indeed, only the Canada Paraplegic Association of Ontario, in its 2009 Annual Report, provided a full set of budget information across financial and non-financial measures using an approach similar to that of a balanced scorecard (see Kaplan, 2001, for more details about the balanced scorecard). 2b. wherearetheno n—financialindic at orsofmission ac c omplishment?
It was also rare for organizations to clearly state their performance targets, programs goals, or objectives. It is very difficult for the reader is to assess if an organization achieves its goals without these performance metrics. Sarnia Lambton Rebound—a Program for Youth, in both the 2008 and 2009 reports, is a good example of how to do it right. The organization goes to great efforts to obtain feedback on what it is doing and reflects that feedback in its annual report. Sarnia Lambton Rebound attempts to measure its impact on the community with concrete numbers and targets. For a more elaborate approach in a larger organization using the balanced scorecard, see Canada Paraplegic Association of Ontario 2009 Annual Report.
problem 3: Not stating the risks, issues, and challenges
In general, organizations like to write about their achievements and how well they are performing. Rarely did a report identify an organization’s risks, issues, and challenges. Unfortunately, not disclosing these items means that readers are not given any insight into the daily struggles that some of these organizations face. We even found a case in the 2009 competition where volunteers were killed serving their charitable purpose; yet there was no discussion in the report of the political instability or the impact of war on the organization’s ability to achieve its charitable purpose.
Organizations need to do a much better job of identifying, assessing, monitoring, and informing the reader of their key risks, issues, and challenges. Is the organization susceptible to funding decisions (especially cuts) made by the federal, provincial, or local government? What is the risk to the organization if donations or government support decrease? What process is in place for the organization to review and manage its risks, both financial and non-financial? Does the organization have a contingency plan? The United Way of Greater Toronto’s 2009 Annual Report does a better-than-average job of discussing the fundraising issues due to the economic problems encountered during the economic meltdown of 2008.
problem 4: Non-disclosure of the governance structure
The disclosure of organizational and governance structures is lacking in the majority of annual reports. The reader is not provided with enough information to understand how decisions are made in the organization. For example, which types of decision are made by the directors and which are delegated to management?
One effective means of communicating this basic information is to provide an organizational chart with the positions within the organization and the names of the people filling each position. In addition, there should be a clear indication of the board’s responsibilities versus management’s responsibilities. The organization should also disclose major board committees, their purpose, their members, and the number of committee meetings during the year. The committees that individual directors sit on should be identified and the relative time commitment for each committee should also be disclosed. Sarnia Lambton Rebound—a Program for Youth reports for both 2008 and 2009 provide excellent examples of governance disclosures for a small organization. Care Canada’s 2009 annual report shows how a larger, more complex organization can make similar disclosures, albeit there is still room for improvement.
problem 5: Lack of clarity in fundraising costs
The judges found a general lack of transparency in the presentation of fundraising expenses. In most cases, organizations did not segregate the fundraising expenses from total expenses. Furthermore, ratios were not provided, such as fundraising expenses as a percentage of total budgeted expenses or revenue, to help the reader determine the size of fundraising expenses in relation to the total operation. The judges are sympathetic to the argument that the negative public perception of an organization that has large fundraising expenses as a percent of revenues may act as a deterrent to reporting this information. However, the judges believe that if other aspects of the report are improved, such as the provision of plans, budgets, performance targets, and measures of organizational program success, the potentially negative public reaction could be mitigated. Furthermore, the judges note that there could be good reasons for fundraising expenses to be high and that the organization should state these reasons. For instance, when you have a new organization looking to start fundraising, you would expect larger up-front costs than in a mature organization using tried and true methods.
The judges believe that public perception about fundraising costs could be improved if organizations
• clearly state their fundraising goals;
• explain the rationale for the fundraising activity; and
• report actual fundraising results compared to the fundraising goal and comment on significant variances.
These steps would give the reader some perspective of the fundraising expenses in relation to the organization’s fundraising goals and objectives. World Vision Canada and Covenant House Toronto both provide starting points for these disclosures, although the judges note that both are works in progress.
problem 6: Lack of discussion and analysis about the relationship between the financial reports and the organization’s service results
While the judges do not want to recommend for-profit approaches for voluntary sector organizations that are not warranted, the judges believe that management, especially of larger organizations, should be writing a short and concise discussion and analysis (D&A) of the year’s activities. This does not need to be elaborate to be effective. See, for example, the very simple but useful management notes in the Sarnia Lambton Rebound– a Program for Youth 2009 Annual Report. Executive directors’ (or other leaders’) reports sometimes verge into this area, but due to the emphasis of those letters on reporting achievements and good news, there is often little room devoted to real analysis.
The D&A is intended to help the reader understand and assess the significant changes and trends, as well as risks and uncertainties related to the results of operations, including the financial condition of the organization. The D&A should, at a minimum, include:
• discussion, analysis, and interpretation of the financial information in light of the mission, objectives and targets for the year;
• key risks, such as funding risks including government and fundraising revenues; and
• future plans of the organization in light of the current year’s operational successes and shortcomings.
problem 7: Poor quality financial information in the annual report
The general problem here is that financial information is not well integrated into the broader annual report. We cite three specific areas in need of improvement. 7a. financialinfor m at ioninreportdoesnotagreewithau di t edfinancialinf or m at io n
At least three finalist reports presented some financial information in the annual report that did not agree with the same information found in the audited financial statements. This oversight could reduce the credibility of an organization given that the financial information in the report could mislead a reader and potential donor. While none of the differences between the text and the financial statements in the finalist organizations were material, consistency between the annual report and the financial statements enhances a report’s credibility, especially with large donors who are more apt to study these items carefully. This consistency includes financial information presented in charts and graphs. 7b. misuseofau di t or s’report s
The judges also observed cases in which the audited financial statement information is only summarized in the annual report but the auditor’s report on the entire financial statements is reproduced. Auditors should not allow the Auditor’s Report to be published without the complete financial statements because it is against professional standards. The more sophisticated donor or reader may raise unwarranted questions about the quality of the audit work performed if the auditor does not ensure that his/her report was used appropriately by the organization. Auditors may provide a separate audit opinion on summarized financial information that is put into the annual report as an additional service to their clients. Organizations are urged to discuss this matter with their public accounting firm, and public accounting firms need to monitor how their audit reports are used. 7c. p ertinentfinancialin f or m at ionisnotdisclo s edtotherea der
The failure to provide a summary of appropriate details of relationships with related parties in one place in the financial statements was found to be a problem in several finalist organizations. For example, the existence of a separate foundation (e.g., for fundraising or for holding endowments) or a for-profit subsidiary separate from the voluntary sector organization is acknowledged in the financial statement footnotes; however, the reason for their existence is not explained either there or elsewhere in the annual report.
problem 8: Annual reports of organizations between $1 million and $10 million in revenue
The judges noted that one particular size of organization seems to have the greatest problems in developing transparent annual reports. In 2008, it was organizations that had annual revenues of between $5 million and $10 million, and in 2009 it was a broader group that had annual revenues of between $1 million to $10 million. It appears that organizations of this size are too big for a single staff person supported by volunteers to put together a transparent annual report but too small to have the expertise present onstaff to successfully put together a project of this complexity. Both smaller organizations (those with less than $1 million in annual revenue) and the organizations (with greater than $10 million) have noticeably superior reports to organizations in this category. Indeed, the judges felt that all of the reports considered that fell into the $1 to $10 million category, including the Award Winners, were works in progress and not final products to be emulated. The judges suggest that organizations in this category view the winners from both the smaller (e.g., Sarnia Lambton Rebound—A Program for Youth) or a larger organizations (e.g., Covenant House Toronto) when considering how to improve their reporting.
Excellence involuntary sector reporting
In this final section, we discuss the disclosures that made for outstanding accountability and transparency in annual reports and audited financial statements. This section is organized by the five major areas of the final judging criteria: accessibility and availability, clarity, user friendliness, and impact.
Accessibility and availability
The judges considered whether an organization’s annual report and the audited financial statements should be available online. Although all organizations in the finalist round included their annual reports on their websites, several did not post the audited financial statements. The judges considered each organization’s rationale for not posting the audited financial statements online as part of the judging process, and those rationales have not been persuasive. Therefore, all award winners to date have had their annual report and audited financial statements (when not included in the annual report) posted online. Even when posted, some of the reports were difficult to find because they were located in website areas such as “Board of Directors” or “Donate.” The reports should be in an easy-to-find category, such as “About Us” or “Publications,” with links from other relevant areas. There should be a minimum of three years of annual reports and audited financial statements available, and they should be posted promptly. World Vision Cana—da does this well, even featuring additional reports over and above the annual report.
The judges also commented that most annual reports did not provide a readily accessible means for people to provide feedback about the report, to comment on the organization’s activities, or even information on how to get involved with (i.e., volunteer with) the organization. World Vision Canada is a notable exception to this as they invite readers to provide feedback on the report and include an easy means of doing so.
A key issue in the accessibility of information is deciding who the primary and secondary target audiences are for the annual report and financial statements. How the organization will structure and write the annual report is determined by what audience(s) the report is targeted at. For example, the audience could be donors, funders (such government agencies), clients, volunteers, or even, possibly, the staff. The primary audience is an explicit choice that needs to be carefully made and adhered to by all contributors to the report to ensure the consistency of language and presentation throughout the report. Sarnia Lambton Rebound—A Program for Youth’s Annual Report in 2008 is an excellent example of a report that seems to be written at a level that its clientele (youth) can identify with while containing the technical content that donors and others need to know. The judges also suggest that the need to consider alternative formats may exist depending on the donor base and those donors be asked how they would like to receive information: electronically posted to the organization’s website, by email attachment, or by mail. One judge notes that assumptions should not be made about computer literacy based on one’s age.
Clarity
The judges could not readily determine the purpose of the organization in over a quarter of the fourteen reports judged in the 2009 finalist round. A fundamental requirement of the annual report is to provide the reader with a clear and concise purpose of the organization. What does the organization do? What is its charitable purpose? What has it done during the year to contribute to their community? A clear purpose gives the reader a sense of the social impact the organization has on the community and constituents.
Without a clear purpose, readers may find it difficult to determine how their donations (either directly or via tax dollars) will benefit their community.
The judges found that most organizations did not consistently weave their mission, vision, and/or purpose with the activities they report on in the rest of the report. The organizations often presented the mission statement early in the report and never referred to it again. Also, organizations often did not create a clear link between their mission and their programs and activities. The judges point to the annual reports of Sarnia-Lambton Rebound—a Program for Youth and Covenant House Toronto as two examples of organizations that consistently linked their activities reporting to their mission statement.
The judges made a number of observations and recommendations with respect to the structure of the annual report. The structure addresses how this information is presented to the reader, not its content per se. The judges identified the Covenant House Toronto Annual Report 2008 as a good model for a reporting structure. Suggestions for improved structure include
1. Communications strategy. The judges commented that most organizations would benefit from having an overall communications strategy for the annual report. They recommended that each organization have a “point” person assigned with responsibility for the annual report’s overall content. This person’s role is to accumulate the information from the board, management, committees, staff, and volunteers and ensure that this information is presented in one clear, consistent and cohesive report.
The organization needs to consider the number, length, content, and cohesiveness of the messages (i.e., the themes to be conveyed) included in the annual report. The communications role would also be responsible for ensuring consistent messages throughout the report. Based on two years of judging, it seems that no more than three messages can be effectively communicated through the report.
The judges noticed that a number of annual reports include numerous reports (i.e., the Chair’s, the Chief Executive Officer’s, various program heads’, etc.) that often overlap, contain inconsistent messages, and feature more messages than can be consumed by even a diligent reader.
2. Executive summary. All annual reports should include an executive summary (and only one summary, as several annual reports had what appeared to be multiple summaries of the rest of the report), located at the beginning of the report. The purpose of the executive summary is to summarize the entire contents of the report for reader. The executive summary should only be one page in length. 3. Amount of information. The judges highlighted two types of annual reports where information amount was a problem:
Type 1: “Too much information.” This annual report tends to be long and dense. The judges highlighted the otherwise award-winning United Way of Greater Toronto as being in this category. Although the report includes a lot of great content, the reader leaves mentally fatigued from the amount of information included in the report. One recommendation to reduce the size and density of the annual report is to include some detailed information (such as lists of contributors) as a separate appendix (or document) to the annual report. The organization then gives readers the option to access more detailed information if they wish. World Vision Canada’s online report is an excellent example of providing more detailed information to supplement that in the annual report.
Type 2: “Lack of content.” The opposite type of report is one that includes too little content or content at too high of a level of abstraction. This annual report leaves the reader with many unanswered questions. Even for “member-focused organizations,” the annual report is an accountability document that may be used for many purposes and it should not be assumed that every reader knows exactly what the organization does and why.
Finally, the judges stated that the reports (although not the financial statement footnotes) were generally written in plain language; however, the judges did identify some spelling and grammar errors in certain reports. Nothing reduces an organization’s credibility as quickly as spelling errors.
User friendliness
The judges strongly recommend that an overall management/board level decision be made about whether to use a narrative or story line to explain the organization’s activities. The report should discuss how the mission, goals, and programs interact, the successes and disappointments in working towards achieving the mission, the risks and challenges the organization faces, and how the organization intends to deal with them. Two-time winner Covenant House Toronto provides a great example of a report that does this. The judges note that in some annual reports there was a tendency to have too many separate activity reports instead of one overall management report that told the organization’s story. When many different styles of writing are combined with a multiplicity of reports, it is hard in some cases to understand the organization as a whole. Finally, there is a need to integrate the financial statement numbers into the story presented in the annual report in order to tie the two together.
The judges were unanimous in their opinion that if the full set of financial statements were not present in the annual report that clear reference must be made to their availability on the organization’s website. Furthermore, the judges were unanimous in their belief that a clear financial summary was required in any annual report, including one that featured the full set of financial statements.4 Treasurers’ reports and financial highlights should be easy to follow into the financial statements. Further, the judges contend that financial statement footnotes should be written in language that is understandable. As the judges pointed out, the financial statements are management’s responsibility and an auditor will help management word the financial statement footnotes in plain English if asked.
In all annual reports, whether they include the full financial statements or not, the judg—es recommended that at a minimum there must be a clear statement of the revenues and expenditures of the organization, including a clear statement of what fundraising expenses were as opposed to program expenses. For larger organizations, a nice model can be found in the Canada Cancer Society, Ontario Division Treasurer’s Report. For those organizations receiving grants, it should be a best practice to link grant and project costs. The uses of graphics such as pie charts are good ideas when preparing summaries for financial information.
While all the judges agreed that pictures could be very effective in telling the organization’s story, they urged a more judicious use of photos and more explicit linking of photos to the story being told on the page. Excellent examples of organizations whose pictures told their story were Sarnia Lambton Rebound—a Program for Youth and Covenant House Toronto. Judges thought that putting the organization into a historical perspective while not overwhelming the reader with detail seemed to make the organization seem “more real” and the story run “deeper.” Further, using this background to explain the mission statement was also noted as an effective communication device.
Impact
The judges identified the Sarnia-Lambton Rebound—A Program for Youth’s Annual Report as noteworthy in the area of the impact made on the reader. Specifically, the report conveys the passion of the organization to the reader and clearly employs financial and non-financial information to relay the impact the organization is having on the community it serves.
The judges believe there is a greater need for organizations to acknowledge risks, issues, and challenges in the annual report. They comment that this is an opportunity missed for many organizations. Informing the reader and potential donor of the risks, issues, and challenges could give potential donors some context and insight as to how their contribution can make a very real impact. Sarnia-Lambton Rebound does this well, as does Covenant House Toronto.
Some organizations seemed to view the annual report as more of a creative writing project or perhaps an advocacy advertisement rather than an accountability document. Beautiful pictures, the latest graphic design, and au courant colour schemes do not make up for lack of content. As one judge put it, “the ghost of creative leads the content” in some finalist reports. This being said, it definitely does not mean annual reports need to look bland, as evidenced by award winner’s Covenant House Toronto 2009 report.
Conclusion: lessons learned to date
Before summarizing our lessons learned based on the first two years experience with the VSRA, we must note two limitations to our study. First, all organizations were self nominated, either by someone associated with the organization (e.g., management, director, or auditor) or another reader of the annual report who thought it was particularly well done. This means that the reports that were submitted are not a random cross section of all voluntary sector annual reports, but rather a selection of reports from those who thought they did at least a reasonably good job and were interested in improvement.
Second, the judges only saw the finalists’ annual reports and financial statements. The technical screening process, while carried out with great care by several chartered accountants, doctoral students, and audit juniors from major public accounting firms may have led to a biased sample of reports submitted to the judges for their consideration. It was only at the final judging stage that non-accountants were involved in judging. Many of the categories judged by the technical screeners were not accounting in nature (see Tables 3 and 4). Whether the screening process lead to a systematic bias in the reports’ relative rankings is not known; however the technical screening scores of the finalists were not revealed in either year to the judges to help guard against any spillover from the accounting dominated screening to the more balanced judging panel in the final round. It is important to note that the final Judges Panel in both years was balanced between accountants and non-accountants and the 2009 competition featured a majority of non-accountants.
Table 6 summarizes our ten key lessons learned gleaned from the first two years of the VSRA. The unifying thread that runs through all of these “lessons learned” is that an integrated annual report that tells a compelling story about an organization’s mission and relates it to the activities carried out and the financial resources available is the key to accountability and transparency for voluntary sector reporting. We look forward to working with more voluntary sector organizations in the years ahead as we continue to strive to improve the accessibility, accountability, and transparency of the reporting of organizations in this important sector of our economy.
table 6: Summary of ten lessons learned
1. Include a strong introduction, with a table of contents, to significantly help orient the reader to the activities of the organization. An executive summary is a “must have.”
2. State clearly the organization’s mission and relate the activities back to the mission throughout the report.
3. Give a clear statement of performance objectives and targets and describe how they link to the mission.
4. Disclose your organization’s risks, issues and challenges in the context of the mission.
5. Tell the reader how your organization governs itself and how that governance structure reflects the mission of the organization.
6. Have management (e.g., the executive director) discuss the financial information in light of the organization’s mission, vision, and values; link that discussion to present operations, risks, and future plans; all should be written in a concise “discussion and analysis” section of the report.
7. Post the annual report and the audited financial statements (if not included in the annual report) on your website in an easy to find area (e.g., “About us”).
8. Decide on your primary audience and write the annual report for them using plain language appropriate to that audience. Use other means to communicate your message to other stakeholders.
9. Balance carefully the “too much information” approach versus “lack of content” approach to arrive at a happy medium in the annual report. Ensure that one person edits the report so that it is internally consistent both with regards to content and to writing style.
10. Avoid committee reports in favour of one broad-based board report that tells the organization’s story in a compelling and integrative manner. The committee reports can be posted to the website if they are considered important disclosures.
Acknowledgements
The authors would like to thank Sara Cousineau for assistance with the final editing of this article; Regan Schmidt (Technical Screening Director for the first year of the VSRA), Qiu Chen (Assistant Director both years), and the junior auditors (all recent Queen’s School of Business graduates) who performed the initial technical screening. We also thank PricewaterhouseCoopers LLP Canada and the associated foundation, which has been the sole sponsor of the Voluntary Sector Reporting Awards since their inception, especially Sara Oates CA, Associate Partner. We also thank the Institute of Chartered Accountants of Ontario, especially Brian Leader FCA, Vice-President Learning, for their financial support for the CA-Queen’s Centre for Governance.
Notes
1 The headquartered-in-Ontario restriction is due to the funder of the Centre being the Institute of Chartered Accountants of Ontario, a body whose mandate extends only to the province of Ontario. However, all national and international organizations headquartered in Ontario were included in the second year of the competition, giving the competition a wider base. 2 A more detailed paper on the methods used to develop the index is available from the first author. 3 In one of the two years, we also had a representative of the not-for-profit media, an editor for a professional not-for-profit journal based in Canada. We also attempted to have a member of the financial media involved in both years but were not successful in obtaining one due to the time commitment involved. The representative of the not-forprofit advocacy group in the first year was the group’s Chief Financial Officer so could also be considered an accountant. 4 The judges were divided, however, over whether the inclusion of a full set of financial statements should be required in the annual report.
References
Ayer, S.M., Hall, M.H., & Voderak, L. (2009). Perspectives on fundraising: What
charities report to the Canada Revenue Agency. Toronto: Imagine Canada and The Muttart Foundation.
Charity Commission for England and Wales. (2004). Transparency and Accountability
(RS8). Liverpool UK: Charity Commission for England and Wales.
Charity Commission for England and Wales. (2004). Hallmarks of an Effective Charity. Liverpool UK: Charity Commission for England and Wales.
Charity Commission for England and Wales. (2005). Accounting and Reporting by Charities: Statement of Recommended Practice—Revised. Liverpool UK: Charity Commission for England and Wales.
Canadian Institute of Chartered Accountants. (2006). Canada’s Chartered Accountants Present: Corporate Reporting Awards 2006. Toronto: Canadian Institute of Chartered Accountants.
Canadian Institute of Chartered Accountants. (2007a). CICA Corporate Reporting Awards for 2007: Judging information. Toronto: Canadian Institute of Chartered Accountants.
Canadian Institute of Chartered Accountants. (2007b). Canada’s Chartered Accountants Present: Corporate Reporting Awards 2007. Toronto: Canadian Institute of Chartered Accountants.
Coy, D., and Dixon, K. (2004). The public accountability index: Crafting a parametric disclosure index for annual reports. The British Accounting Review 36, 79-106.
Government of Western Australia. (2006). Western Australian public Sector Annual
Report Framework. Perth AU: Office of Premier and Cabinet.
Institute of Public Administration Australia (IPAA) ACT Division. (2006). IPAA annual report awards 2004-2005 Judges Report. Canberra AU: Institute of Public Administration Australia.
Intelligent Giving. (2008). Our plans for the future. URL: http://www.intelligentgiving. com/about_us/future_plans [May 23, 2008].
Kaplan, R. S. (2001). Strategic performance measurement and management in nonprofit organizations. Nonprofit Management and Leadership. 11(3): 353-370.
Muttart Foundation. (2008). Talking About Charities: Canadians’ Opinions on Charities and Issues Affecting Charities. Edmonton AB: Ipsos Reid Public Affairs.
Nelson, M., Banks, W., and Fisher, J. (2003). Improved accountability disclosures by
Canadian universities. Canadian Accounting Perspectives 2(1) 77-107.
PricewaterhouseCoopers—Australia. (2008). PricewaterhouseCoopers transparency awards. Sydney AU: PricewaterhouseCoopers—Australia.
PricewaterhouseCoopers Netherlands. (2006). Transparency award 2006: Evaluation criteria for the 2006 transparency award. Amsterdam: PricewaterhouseCoopers Netherlands.
Statistics Canada. (2004). Cornerstones of community: Highlights of the national survey of nonprofit and voluntary organizations. Ottawa: Minister of Industry.
Steve Salterio, ph.d. fca, is Professor of Business, the PricewaterhouseCoopers/ Tom O’Neill Faculty Fellow in Accounting and the Director of the CA-Queen’s Centre for Governance at the Queen’s School of Business. He has extensive experience in the not-for-profit sector, including sitting on volunteer boards for organizations ranging in size from a few dozen to ten thousand members. Steve cofounded the Queen’s Program “Fundamentals of Governance for Crown Agencies and Notfor-Profit Boards” in 2004 and the Voluntary Sector Reporting Awards in 2007. He is an international award-winning researcher who has a textbook, several book chapters, and over 50 articles to his credit. Email: ssalterio@business.queensu.ca
Patrick Legresley, ca, is Associate Director, Finance at the Queen’s School of Business. Prior to this appointment, Patrick was with a major public accounting firm carrying out audits of notfor-profit organizations of all sizes. He is the Technical Scoring Director of the 2009 and 2010 VSRA competitions. He received his BCOM (Hons) from the Queen’s School of Business in 2002. Email: plegresley@business.queensu.ca