The real trouble with this world of ours is not that it is an unreasonable world. nor even that it is a reasonable one. The commonest kind of trouble is nearly reasonable, but not quite. Life is not an illogicality; yet it is a trap for logicians. It looks just a little more mathematical and regular than it is; its exactitude is obvious, but its inexactitude is hidden; its wildness lies in wait.
G.K Chesterton1
Tactical asset allocation will earn nothing if investors are never foolish and will lose everything if investors are never wise (or if the parameters burst, fundamentally recalibrating the definition of wisdom). The only certainty is that our favourite parameters, some day and somewhere, are going to burst At that moment, the enemy that is us will have no allies but ourselves.
Peter L. Bernstein2
The market will fluctuate.
J.P. Morgan
Introduction
For centuries, possibly at least 2,000 years, businessmen have understood that higher returns are usually associated with higher risk. In the Summer, 1988 issue of The Philanthropist a systematic exception to this rule was explained. This article updates the data on investment returns and the analysis. Information is available now for the last 66 years for long bonds and stocks. For other categories, information is available for the last 33 years and more still for the decade of the eighties.
Summary of the Earlier Article
1. Most foundations and endowments regard themselves as perpetuities.
They wish to at least maintain their value in after-inflation terms and to continue to grant on an equivalent or growing basis.
2. To achieve these goals, investment income and capital gains are just as valuable as new donations. Returns on the assets, and the risks taken to achieve those returns, are important now and in the future.
3. This being so, anyone responsible for the investment of foundation or endowment assets must continually ask two questions. The first is: “Are the investments appropriate for the purpose?” This relates to strategy and policy.The Investment Committee should be concerned with longer-term strategy and policies, and ensure that the investment manager agrees with and understands them. The investment manager, in turn, will implement short-term policies consistent with the long-term strategy, and explain these adequately to the Investment Committee.
4. The second question is: “How good is the performance?” This must be examined in two respects-the returns and the risk levels. As with any process, management responsibility involves review and measurement (Since both rising and falling markets should be included, four-year periods have become normal for performance measurement) Relative overall risk can be measured in a generally accepted way.
5. Objectives must be established and specified in writing. A prerequisite to questions about perfollJlance is that you must decide where it is that you want to go. That is, you must establish and understand your objectives before you will know what it is that you need to measure. A simple but clear statement of objectives can be effective for the purpose. Different foundations will have different objectives, but liquidity is not apt to be important except in rare cases.
There must be agreement between the Investment Committee and the investment manager on the objectives, strategies and general policies.
6. Performance comparisons between foundations and endowments would be valuable, but this is still difficult because relatively few foundations have arranged for external performance measurement As an alternative, comparisons can be made with mutual funds and pension funds.
7. Foundations can be different from mutual funds and pension funds both in their objectives and in their cash flows. Foundations normally cannot depend on a continual inflow of funds. As well, to maintain their charitable status for tax purposes, foundations face a requirement to distribute at least 4.5 per cent of the average value of the assets each year. Moreover, the directors will desire to be generous.
8. For the purpose of compliance with the Income Tax Act, it is immaterial whether the money disbursed ha pens as “income” or as “capital gain”. Once the money has been received they are equivalent; both represent a return on investment No one would buy equities with a yield of three or four per cent6 while double-digit returns are available unless there was an expectation of some other return, i.e., capital gain. Thus the foundation’s objective of remaining a perpetuity is still met if capital gains are used to meet the
4.5-per-cent requirement
9. The total return, including both income and capital gain (or less capital depreciation), should be measured and compared. In fact, the Securities and Exchange Commission as well as regulators in Canada require this for mutual fund comparisons.
10. Time-weighting removes the effect of deposits and withdrawals from the measurement of the returns. Any other basis (e.g., internal rate of return) cannot reasonably be used for comparisons. That this is fundamental is agreed upon by various Canadian and United States regulatory authorities, the Association for Investment Management and Research, mutual fund associations, etc.
11. The returns reported in my articles are the real returns, i.e., returns after adjustment for the Consumer Price Index. This is expected to be consistent with the objectives of most foundations.
12. Despite the dreams of most investors, institutional and other, it is theoretically not possible consistently to achieve fine-tuned timing of investments.7 In the real world, only 21 per cent of mutual funds outperformed the Toronto Stock Exchange 300 Index over the 10 years to 1987 after management fees and expenses. (fhe record has improved considerably since then.) Virtually no one consistently outperforms the market each year over any 1 year appear to be related to selection of investments, rather than market timing.
13. The market timing of increases and decreases in the median commitment of pension funds to the stock market has been a notorious example of petVerse decisions. The levels of cash and short-term securities held by mutual funds have been so incorrect that such levels are now used as indicators of what not to do. (fhe logic behind this conclusion may be that a large amount of liquid funds held by a major component in the market indicates nascent buying power. The mutual funds as a group push market prices against themselves.)
14. Another guide to investment is the Investment Advisory SeiVices Index.
Whenever the investment advisory services are predominantly bullish, it has usually been a favourable time to sell equities, and vice versa.
Unfortunately, you cannot depend on that either.
15. Forecasts of interest rates and exchange rates have similar poor track records, despite the application of massive amounts of study, intellect, dedication and effort
16. Is there reason, then, to expect that the investments of foundations and endowments in general will be managed much more successfully?
Based on this catalogue of disappointments, a stable, or relatively stable, allocation of funds among various classes of investment must be recommended.
17. Virtually all investors seek a high total return, preferably in a reasonably even flow, with low risk. Since the dawn of investment history, a higher return has usually been associated with a higher risk. However, an exception is presented in the report. There is no point in accepting a lower return if you do not enjoy lower risk!
Risk may be allocated to five categories:
– market value risk
– default risk
– interest rate risk
– liquidity and marketability risk
– purchasing power, i.e., inflation, risk.
(Now that international investing is popular, we had better add political risk and exchange risk, although these could be allocated to one of the above categories.)
18. Overall, risk can be related to volatility, except to some extent for default risk, liquidity risk, and inflation, which can be considered separately. Default risk, by definition, does not apply to common stocks, because equities normally have no guarantees. Liquidity risk is important, but is not properly a subject for this paper. Purchasing power risk is handled here by only using data adjusted for inflation.
Volatility is the usual definition of general risk. In reality, people are only concerned about downward fluctuations, but returns tend to be symmetrical about the average, so the definition is reasonable. (In case you care, “beta” is now considered to be a less satisfactory measure of volatility than the standard deviation.)
19. A decline in the value of foundation investments may lead to reducing charitable grants.That hurts.”Optimum” portfolios are those that have the highest overall return for a given level of risk. Once you have decided upon your comfort level of risk, you should not accept a lower return than necessary for that level.
Update
Investment theory and practice have become much more complicated in the last decade (e.g., the available instruments have multiplied), but many principles remain unchanged.
Overview of Historical Record
Reliable Canadian investment returns are now available for almost the last two-thirds of a century, but only for long bonds and stocks. Data for treasucy bills and mortgages are available for the past 33 years, and information on mid-term bonds is given here for the decade of the eighties.
Since 1923 there have been periods of prosperity, boom, bust, depression, war, inflation, disinflation; periods of complete faith in government “fine-tuning” and its failure and collapse; supply-side economics; periods of fiscal responsibility and then previously incredible fiscal deficits; the quintupling of oil prices and then their collapse; periods on the gold standard, managed exchange rates and wild fluctuations in currency levels; periods when monetacy authorities caused monetacy inflation and the early 1980s when they battled inflation.
The past carries no guarantee for the future, but you can’t tell where you are going unless you know where you have been and where you are. To look forward we will need all the knowledge and insight we can muster.
The Past 66 Years: 1924 to 1989
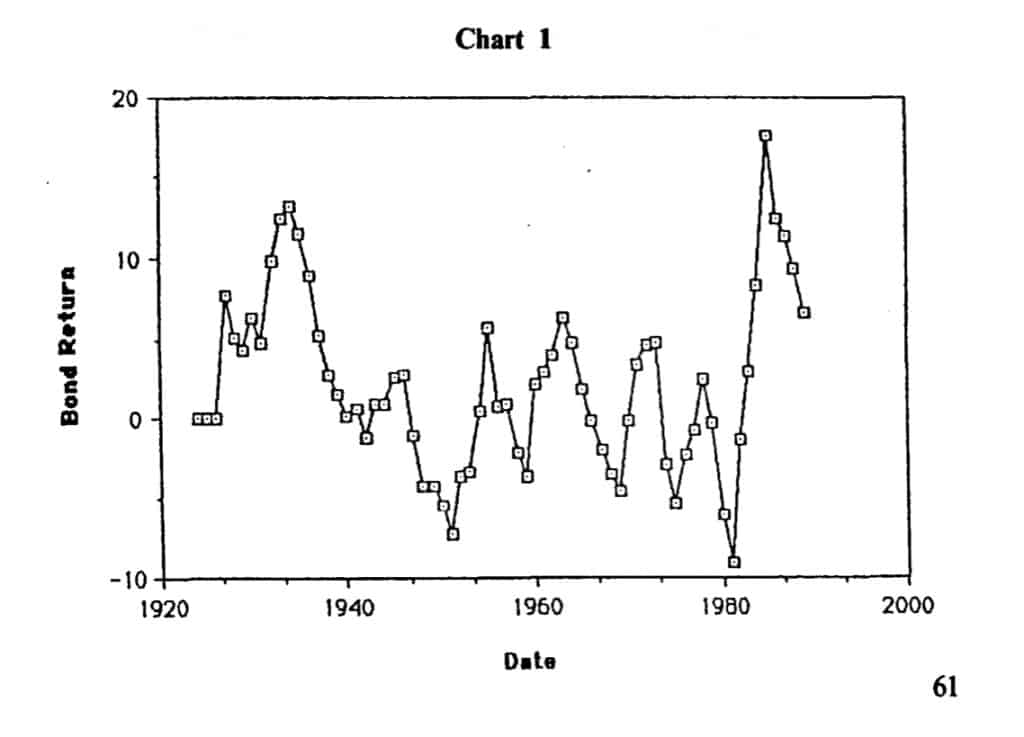
Chart 1 shows the annual real returns after inflation on long bonds8 since 1923, but they have been smoothed to make the chart more readable. The chart actually shows the average annual rate of return based on rolling four-year periods. Presumably, and it is to be hoped, foundations are really interested in investment periods longer than one year.
Chart 1
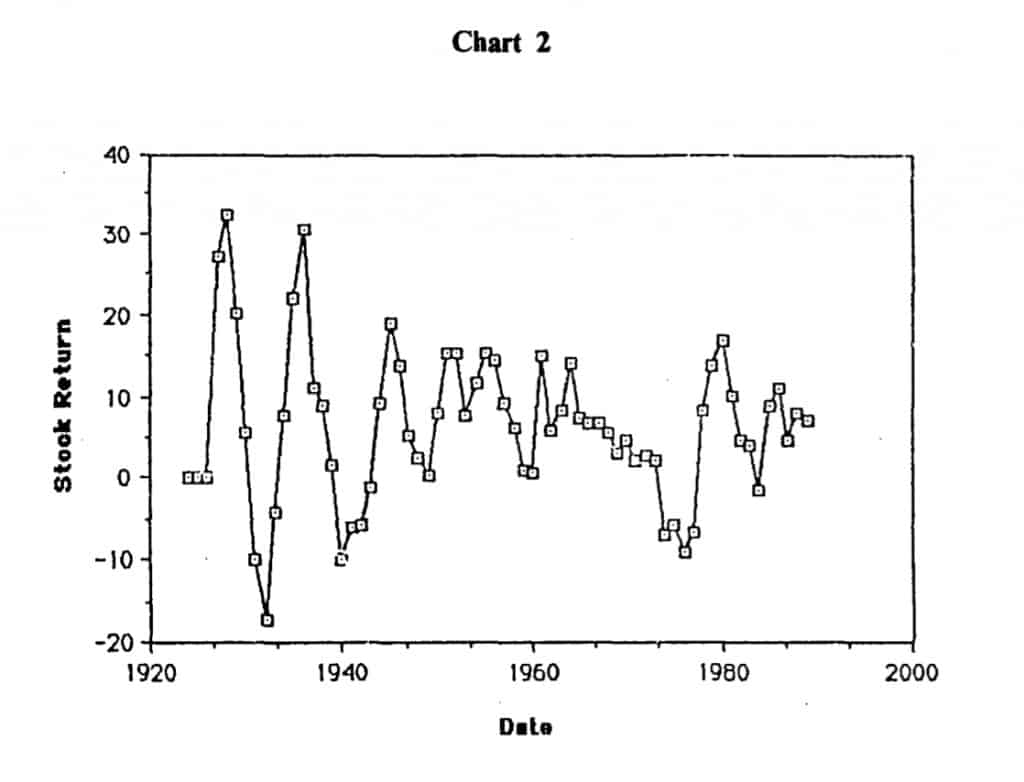
Chart 2
The second chart shows the comparable returns after inflation on common stocks9 each year, smoothed as before. The scale of the two charts is not comparable.
Diversification
An important observation that emerges from these long studies is the value of diversification in reducing risk. The inclusion of some equities in portfolios has often been used to enhance total return, but this can also reduce risk! Portfolios diversified between bonds and stocks have been less risky (i.e., less volatile) over time, and also had higher returns, than portfolios invested solely in bonds. Unusually bad returns were avoided more often if some equities were included. Portfolios 40 to 50 per cent invested in equities had the lowest downside risk. This applied over the full 66 years, over the last one-third of a century, and also over the last decade. (The explanation follows Table 1, p. 65.)
The measure of variability (i.e., risk) used in these studies is the standard deviations10 of annual rates of return, but rolling four-year periods are used to modify swings. Four-year periods are traditionally used by many institutional investors to catch complete market swings.
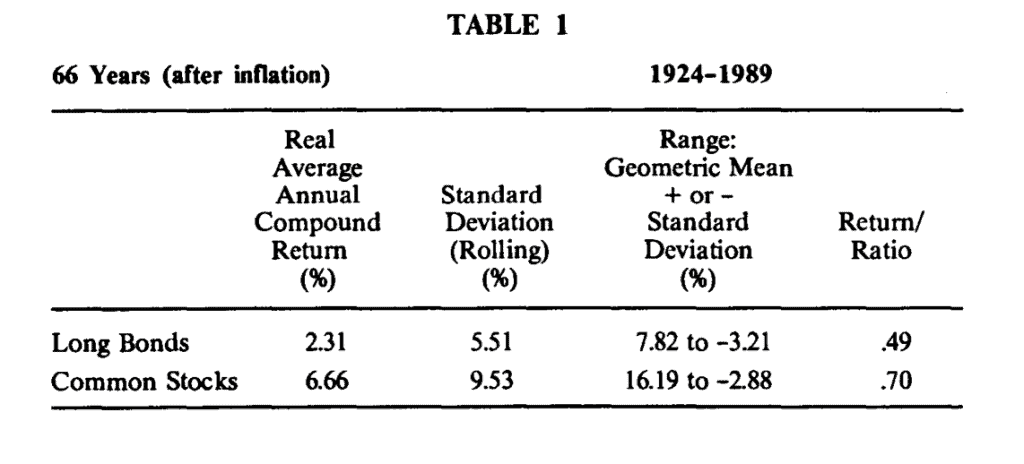
Over more than six and a half decades, the average annual return on long bonds was 2.31 per cent after inflation 11• The average real return on common stocks was 6.66 per cent over these decades. It is normal for the returns on equities to be higher than on debt, as the equity owner must decide to incur debt and pay interest with the expectation that the return on capital will leave a profit remaining.12As a matter of fact, returns on equities have been historically higher than on bonds in the United States, United Kingdom, Switzerland, and Japan 13, and probably other countries.
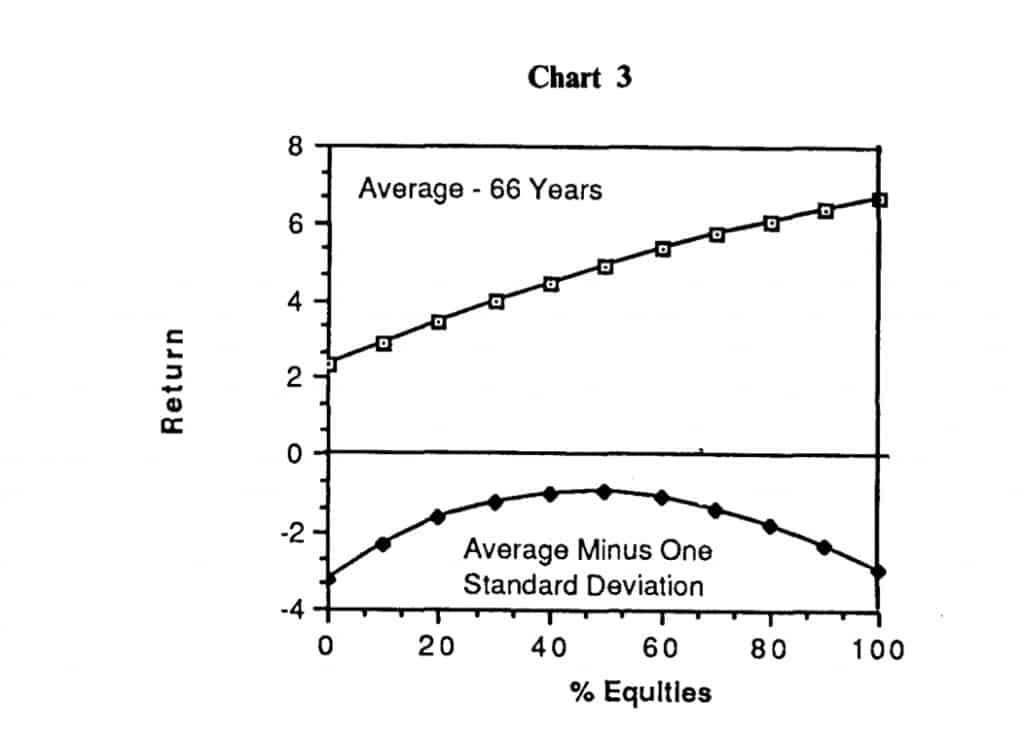
Portfolios with a mixture of these bonds and equities would have had returns between these two rates. The upper line on Chart 1 shows the average compound returns if 10 per cent, 20 per cent, etc. of the portfolio had been invested in these common stocks.
The lower line on Chart 3 shows the average return, minus one standard deviation, for portfolios with various percentages invested in bonds vs. common stocks. Normally, about 16 per cent of the returns would fall below this lower line. The variability of four-year rolling periods (and so the standard deviation of these) is about one-third to one-half of the annual variability.
The lower line can thus be considered as an indication of the degree of downside risk. You will notice that the downside risk is much greater if the fund is invested all in bonds (or all in stocks) than if it is diversified.
Over the full 66 years, the least risk occurred when equities amounted to 40 to 50 per cent of the total of bonds and common stocks.
Readers will be able mentally to project a third line on these graphs, above the others, showing the average return plus one standard deviation. However, most investors are less concerned with upside fluctuations.
You may have noticed that the upper line on this graph is not a straight line. This fact, i.e., that the return in the more balanced portfolios is more than proportionate shares of a 100 per cent bond portfolio and a 100 per cent stock portfolio, is due to “rebalancing” (i.e., returning to the previous percentage breakdown) every year. The fact that the line is not straight proves that there is value in maintaining the portfolio balance. The direct benefit (before expenses) is fairly certain, but not great
Table 1
Column 1 in this table shows the averages of the annual compound real returns for rolling four-year periods. Column 2 has the standard deviation of these.
Column 3 of Table 1 shows the range of one standard deviation above and below the average. This range usually covers about two-thirds (68 per cent) of the results. (“Geometric mean” is identical to the “average annual compound rate”, but makes a shorter heading.)
The heading of the final column is a misnomer to some extent, but it has the advantage of brevity. It shows the ratio of the average return to standard deviation (the Sharpe Ratio). We do not try to indicate that this is the best way to determine return vs. risk. Several serious caveats are appropriate. It is one calculation-a simple one-aimed at the consideration of reward compared to risk.
There are several interesting points to be distilled out of the mass of data. Chart 3 relates to the data in this table and proves the value of diversification.
The returns on stocks were higher than on bonds over any 10-year period except for the one ending last year and a few others. At the risk of deluging you with statistics, in 88 per cent of the 10-year periods, stocks had a higher return than bonds. As noted earlier, this should be expected.
Since the crash of October 19, 1987, everyone is aware of the risk involved in stocks, but this risk (as measured by fluctuations over rolling four-year periods) has been only of the order of one and a half times that for bonds.
If you are interested in nominal returns before adjustment for inflation, the average compound return on bonds was 5.75 per cent and 10.06 per cent for stocks. The return/risk ratios would change drastically to about 1 1/4 and 1 respectively if before-inflation data were used. In fact, the relative rank of these reverses. This is one demonstration of the limited usefulness of this indicator of return vs. risk.
The Long Bond Index calculated by ScotiaMcLeod is designated to reflect the “Canadian bond market”. The share of the total value represented by government bonds in this index has risen dramatically from around 10 per cent in 1976 to about 60 per cent now! As noted earlier, information is available only on government bonds prior to 1948. We currently seem to be getting closer to the position where bonds issued by governments are almost the only ones available.
The Past 33 Years: 1957 to 1989
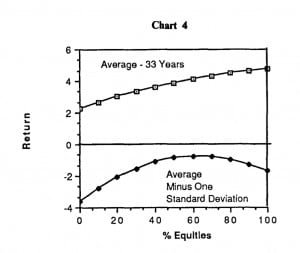
Chart 4 (for 33 years) may seem broadly similar to the previous one, yet there are differences. Both show real returns on portfolios with various proportions in bonds and common stocks. The return and the volatility of bonds after inflation are roughly similar in each period. However, the real return on stocks has fallen somewhat in the more recent decades. Surprised? The volatility also drops now that the 1920s and the depression years are excluded.
Also, the lower line on Chart 4 peaks with a higher percentage of equities than in the earlier chart. The least downside risk now resulted if 50 per cent to 60 per cent of the portfolio was in common stocks. (For the decade of the eighties by itself, the least downside risk again occurred when 40 per cent to 50 per cent of the portfolio was in equities.)
When I saw some large negative real returns in the data for the 1960s and 1970s, I thought that errors had crept in. How soon we forget!
At least charities and foundations did not have to pay income taxes on the nominal interest It took years for many people to really understand
the extent to which inflation and taxes were killing, or more than killing, their high nominal returns. The negative real after-tax returns were truly awful in some years.
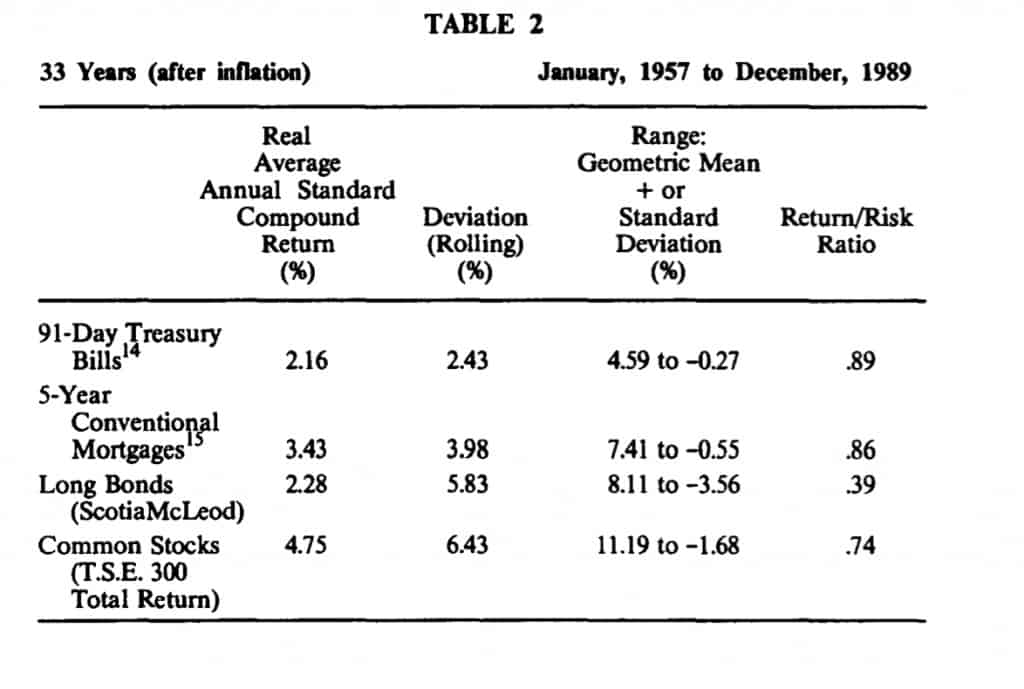
TABLE 2
The nominal average compound returns before adjustment for inflation were 7.52 per cent for long bonds and 10.12 per cent for stocks for this period. The return/risk ratios would change drastically to 1.31 and 1.50 respectively if before-inflation data were used.
The Decade of the Eighties
Data are now available on mid-term bonds for a 10-year period-the eighties.
The worm has turned for debt vs. equity at least temporarily; the returns on bonds rose above the level for equities. As noted above, this is not the normal pattern.
In the early 1980s, bonds fluctuated wildly, more than in previous years, with the result that for this decade as a whole, they were a little more volatile than equities.
Over these years, and probably others, the volatility for mid-terms was less than three-quarters of the number for long bonds. Standard bond theory would lead us to expect mid-term bonds to fluctuate less than long ones, but mid-term bonds in fact fluctuated more than most investors would expect. That is, the fluctuations of mid- and long-term bonds are more similar than theory would lead us to anticipate. Mid-term bonds have shorter durations and always swing less in price for a given change in yield. However, the mid-term yields swung more than long-term yields in this decade.
In other words, mid-term bonds are safer than long ones, but not as safe as most people seem to expect.
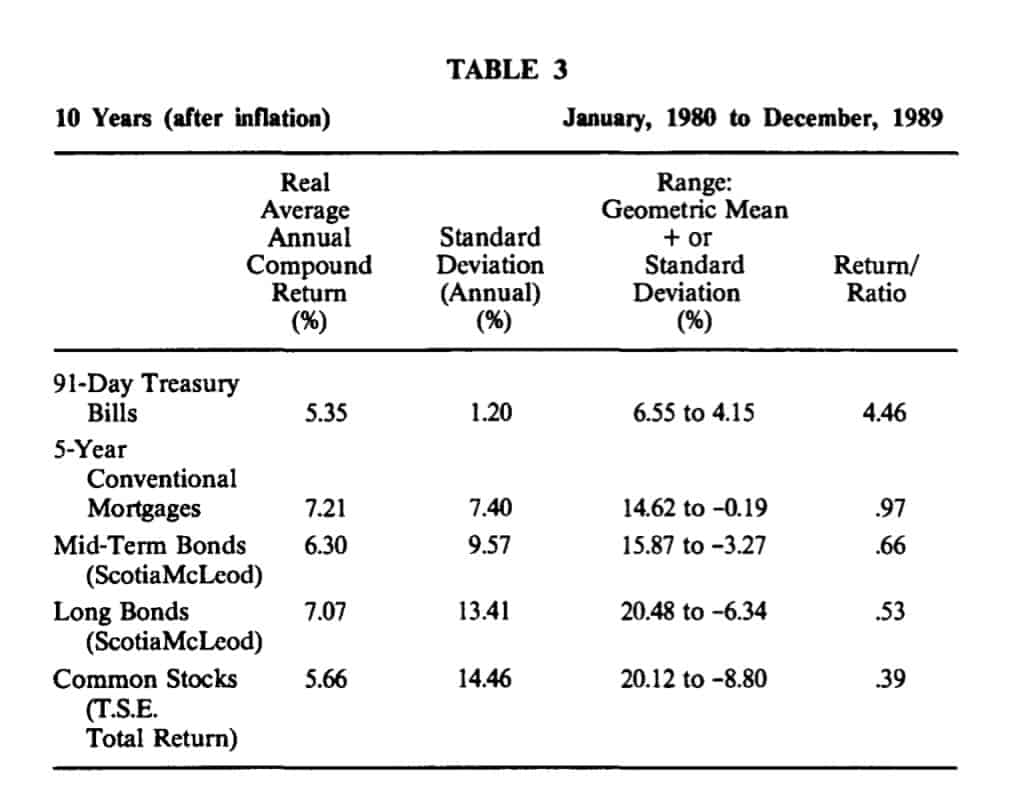
The pattern for the last 10 years is shown in Table 3 but, because the number of years is so small, we must use the standard deviations of annual returns, not the four-year rolling average. Therefore, these cannot be compared with the standard deviations for the longer periods.
The nominal average compound returns before adjustment for inflation were 13.73 per cent for bonds and 12.23 per cent for stocks for this period. The return/risk ratios change to .98 and .84 respectively if before-inflation data are used. At least they retain the same rank this time.
TABLE 3
From the end of last year to the end of April, 1990, the long bond index has declined by 12.0 per cent and the T.S.E. 300 Total Return Index has declined by 16.4 per cent, in real terms. Spread over a decade or more, this does not have a really major effect on the results for any of the periods in this study.
The variability of bond prices actually has shot up in this decade, partly because the United States Federal Reserve Board changed its policy from that of moderating interest rates to that of moderating money supply and inflation.
Mortgages also fluctuate much more than in the past. Until a decade or so ago, institutional mortgage departments were given a budget for three or six months or more. Their rates reflected the market for mortgages, which were to a large extent independent of other investment markets. This pattern gradually changed. Now that consumers have become more sophisticated and knowledgeable, market rates for guaranteed investment certificates (GICs) change hourly sometimes. Institutions have learned, sometimes the hard way, the need to balance asset and liability returns continuously.
This explains why mortgage rates move rapidly now, whereas they used to move very gradually, smoothing out the peaks and valleys of more volatile markets. With this increase in volatility, the statistical and historical stability of mortgage returns has changed.
Some General and Subjective Observations
1. With regard to market timing (referred to in 12, 13 and 14 of the summary of the earlier article), some investment managers now tell their clients that they do not attempt to time the market. Good.
Ninety-one large United States pension funds tracked over 10 years lost .66 per cent per year from attempting market timing.16
2. Earlier (in 14 above), it was pointed out that investment advisory services for stocks could be used as an indicator of the action not to follow. Investment advisory services for bonds and gold as groups are also perverse in their advice, but that cannot be depended on eitherP
3. The determination of an optimal portfolio has been exemplified here for two variables-bonds and stocks. A similar process can be applied to other investment vehicles, even real estate if acceptable numbers can be found. However, the calculations rapidly become more complicated, and therefore less dependable, as the number of variables rises.
4. Unintended cash reserves sap portfolio returns over time, as short-term returns are typically below long-term returns. The shortfall has been considerable for many endowments and pension funds.18 Investment managers working into the night will be unlikely ever to add enough value to offset the unnecessary leaks of performance that are common. However, this advice may not apply at present as short-term rates exceed long-term rates.
5. Investment theory has expanded greatly in the last decade but a good part of it is not useful to the practitioner.
6. “Derivative securities” (e.g., options, futures, portfolio insurance) can be intriguing and can modify risk substantially. Acceptance has grown, but they remain unfamiliar to many investors. As a broad generalization, the costs will discourage most investors at present.
7. Without going into detail, five categories of strategy are available for the rebalancing of a portfolio as market values fluctuate: (This ignores trading between individual securities.)
a. Attempt Market Timing.
b. Buy and Hold. Do nothing with existing levels of bonds and stocks.
c. Constant Mix. Exposure to equities is maintained at a constant proportion of the total assets. Buy stocks as they fall.
d. Constant Proportion Portfolio Insurance. This involves selling stocks as they fall, and buying stocks as they rise.
e. Options-Based Portfolio Insurance. Brief explanations of “d” and “e” are apt to be unsuccessful.
8. One influence that cannot be measured has not yet been considered here. There has been a massive increase in debt by all sectors in Canada, the United States and around the world. Our federal, provincial, corporate and individual borrowings have risen. Non-financial debt on this continent is at record levels as a percentage of gross national product The pattern in the United States is worse in respect of leveraged buy-outs and junk bonds, but their federal deficit isn’t nearly as serious in relative terms as Canada’s. Everyone is aware of the debt problems of developing countries, but these are a relatively small part of the total problem.
One part of the phenomenon is represented by the many billions of dollars of intra-day loans which are literally revolving continuously around the world. This is fun as long as the party lasts, but the risk of international collapse continues.
There is no way to forecast correctly the timing of an international debt collapse. Its effect on equities would be much more drastic than on bonds, because equities arc junior securities. By definition, they arc leveraged more than bonds.
9. The globalization of markets is a fascinating fact and can improve liquidity, but it docs not necessarily increase stability or investment returns. Recent developments like globalization, computer trading, and index options and futures have compressed the action in financial markets into much shorter time frames.
10. Many Canadians and Americans start their days observing television reports covering global investment information. They want to know the currency and equity market activity that has occurred in Japan and Europe before our business day begins. The world really is shrinking.
11. While it has not been proven here, diversification among various maturities has advantages to investors. This practice will moderate swings in prices and yet provide returns between the best- and worst-performing maturities. Investors should not expect to be able to correctly “call” most swings in bonds.
12. Peter Drucker, the management guru, apparently feels that businesses can now learn from some non- rofit examples of effective operation. 9 He says, “The best management practice and most innovative methods now come from the Girl Scouts and the Salvation Army.”
There is an exception to that as regards some Canadian foundations. Large investors, other than foundations, for many years have been properly measuring their investment performance and ranking it with other comparable funds. This applies to mutual funds, pension funds, trust and insurance companies and larger foundations and endowments in the United States. In contrast, a number of Canadian foundations do not have their investment returns, including income, externally measured and compared on a time-weighte<f 0 basis. Surprising.
13. A market has not yet developed on this continent for inflation-indexed bonds.
14. Do bond and stock markets move together, or not? The classical view is that they do not Inflation has a similar effect on prices in both markets. However, higher income offsets capital losses due to the price declines. The result is that the effect of inflation on total returns is statistically very weak.
In the last 33 years, the returns moved in the same direction in 18 years and in opposite directions in 15 years. There now is a slight positive correlation between bond and common stock prices.
Summing Up
The advantage of diversification of investments has been demonstrated again by research covering periods of various lengths, one extending over virtually two-thirds of a century. Historically, the inclusion of both bonds and stocks in a portfolio has produced both higher returns and lower risk than a portfolio invested only in bonds.
This is a direct exception to the traditional wisdom, which has always held that higher returns are associated with higher risk.
Experience has shown that attempts to time correctly the increase or decrease of investments have more often than not been unsuccessful. Therefore, a portfolio with a relatively stable percentage invested in equities is recommended.
The charitable needs you seek to meet would usually be expected to rise when a recession occurs, yet this may well be just the time when your market values are depressed. I hope nobody told you it was going to be easy.21
FOOTNOTES
1. As quoted in F.R Macauley, Some Theoretical Problems Suggested by the Movement of Interest Rates, Bond Yields and Stock Prices Since 1856, National Bureau of Economic Research, New York, 1938.
2. Financial Analysts Journal, November, 1989.
3. Based on a quotation from a Roman businessman in the first century B.C., reported in the Journal of Portfolio Management.
4. Robert Anglin, “Real Returns and Volatility of Various Classes of Investments”, (1988), 7 Philanthrop., No.4, pp. 42-56.
5. John Hodgson, “What is Capital? What is Income?”, (1988), 7 Philanthrop.,
No. 2, pp. 24-32.
6. Yield, Toronto Stock Exchange 300 Index, mid-May, 1990: 3.60 per cent
7. Chua, Woodward and To, “Potential Gains from Stock Market Timing in
Canada”, Financial Analysts Journal, September-October, 1987.
8. The data for “long bonds” in the 66-year study are based on the ScotiaMcLeod
(formerly McLeod Young Weir) Long-Term Bond Index between 1948 and
1989. This reflects a weighted universe of Canadian long bonds. Between
December 1923 and 1947, indices prepared for the Canadian Institute of
Actuaries are used and linked to the ScotiaMcLeod Index. Indices prior to
1948 are based on Government of Canada bonds over 10 years.
9. “Common Stocks” refers to the Toronto Stock Exchange 300 Composite Total Return Index from 1956 to 1987. From 1950 to 1956, the Hatch-White reference (see Bibliography) was used. Figures from the C.IA. study for the period prior to that were linked to this and the T.S.E. Index.
10. Standard Deviation is a statistical measure of dispersion of results about the mean value. About 68 per cent of results in a normal sample will range within one standard deviation above and below the average, i.e., there are two chances out of three that a given year will fall in this range. This measure takes into account both the probability and magnitude of a range of outcomes, and the amount the return is likely to diverge from the expected return.
11. Inflation measurement based on the Canadian Consumer Price All-Items
Index.
12. The return on the T.S.E. 300 was higher than the return on long bonds over any 10-year period studied except for decades ending in 1937, 1938, 1939, 1940, 1977, 1978, and 1989.
13. Journal of Portfolio Management, Winter 1989, Vol. 15, No.2.
14. ScotiaMcLeod.
15. Ibid.
16. Institute of Chartered Financial Analysts, Managing Investment Portfolios-A Dynamic Process (Second Edition), pp. 13-22. Institute of Chartered Financial Analysts, Charlottesville, VA, 1990.
17. Reported regularly in the Bank Credit Analyst, Bermuda, and others.
18. Supra, footnote 16, pp. 13-24.
19. Drucker, Peter F., “What Business Can Learn from Nonprofits”, Harvard
Business Review, July-August, 1989, No.4.
20. That is, adjusted for external deposits, withdrawals, and income.
21. Data prepared for this report, including actual returns in current dollar terms, are available, but are too extensive (and difficult to read) to include here. They are available from Auriga Financial Consultants Inc., 131 Strathallan Blvd., Toronto, Ontario, M5N 1S9.
Books
BIBLIOGRAPHY
Canadian Institute of Actuaries. Report on Canadian Economic Statistics, 1924 to 1987. (Unpublished report, 1988).
Fabozzi, Frank J. (ed). Managing Institutional Assets. Ballinger Publishing Co. Hatch, J.E. & White, RW., Canadian Stocks, Bonds. Bills and Inflation: 195 1987.
Institute of Chartered Financial Analysts, Charlottesville, VA. 1985.
Ibbotson, Roger and Sinquefield, Rex. Stocks, &nds, Bills and Inflation: Historical Returns (1236-1987). Institute of Chartered Financial Analysts, Charlottesville, VA. (also 1990 Yearbook).
Institute of Chartered Financial Analysts. Asset Allocation for Institutional Portfolios. Institute of Chartered Financial Analysts, Charlottesville, VA. 1987.
Institute of Chartered Financial Analysts. The Challenges of Investing for Endowment Funds. Institute of Chartered Financial Analysts, Charlottesville, VA. 1987.
Institute of Chartered Financial Analysts. Improving Portfolio Performances with Quantitative Models. Institute of Chartered Financial Analysts, Charlottesville, VA. 1989.
Institute of Chartered Financial Analysts. Managing Investment Porrtolios-A Dynamic Process (Second Edition). Institute of Chartered Financial Analysts, Charlottesville, VA. 1990.
Institute of Chartered Financial Analysts. Performance Measurement: Setting the Standards. Interpreting the Numbers. Institute of Chartered Financial Analysts, Charlottesville, VA. 1989.
Institute of Chartered Financial Analysts. Quantifying the Market Risk Premium Phenomenon for Investment Decision-Making. Institute of Chartered Financial Analysts, Charlottesville, VA. 1989.
ScotiaMcLeod Handbook of Canadian Debt Market Indices, 1947-1989. ScotiaMcLeod Inc., Toronto, 1990.
Articles
Ambacktsheer, Keith. “Pension Fund Asset Allocation: In Defense of a 60/40 Equity/Debt Asset Mix”. Financial Analysts Journal, September, 1987.
Anglin, Robert. “Real Returns and Volatility of Various Classes of lnvestment Over Long Periods”. (1988), 7 Philanthrop., No.4, pp. 42-56.
Arnott, Robert D. and Henrikson, Roy D. “A Disciplined Approach to Global Asset Allocation”. Financial Analysts Journal, March, 1989.
Berry, Michael A, Burmeister, Edwin and McElroy, Marjorie. “Sorting Out Risks Using Known APT Factors”. Financial Analysts Journal, March, 1988.
Bookstaber, Richard M. and Pomerantz, Steven. “An Information-Based Model of Market Volatility”. Financial Analysts Journal, November, 1989.
Boyle, Phelim P. “Valuing Canadian Mortgage-Backed Securities”. Financial Analysts Journal, May, 1989.
Carlton, Colin. “Risk and Return in Canada’s Capital Markets: A Historical Perspective”. Canadian Investment Review, Spring, 1989.
Chua, Jess H., Woodward, RichardS., and To, Eric C. “Potential Gains from Stock Market Timing in Canada”. Financial Analysts Journal, September, 1987.
Clarke, Roger G., FitzGerald, Michael T., Berent, Phillip and Statman, Meir. “Market Timing with Imperfect Information”. Financial Analysts Journal, November 1989.
Droms, William G. “Market Timing as an Investment Policy”. Financial Analysts Journal, January, 1989.
Farrell, James L. “A Fundamental Forecast Approach to Superior Asset Allocation”. Financial Analysts Journal, May, 1989.
Farrelly, Gail. “Assessing Risk Tolerance Levels: A Prerequisite to Personalizing and Managing Portfolios”. Financial Analysts Journal, January, 1989.
Ferguson, Robert. “On Crashes”. Financial Analysts Journal, March, 1989. Fuller, Russell and Wong, G. Wenchi. “Traditional versus Theoretical Risk
Measures”. Financial Analysts Journal, March, 1988.
Ippolito, Richard and Turner, John. “Turnover, Fees and Pension Plan Performance”. Financial Analysts Journal, November, 1987.
Jeffrey, Robert H. “A New Paradigm for Portfolio Risk”. The Journal of Portfolio
Management, Vol. 11, No. 1 (Fall, 1984).
Jones, Charles P. and Wilson, Jack W. “Is Stock Price Volatility Increasing?”
Financial Analysts Journal, November, 1989.
Khaksari, Shahriar, Kamath, Ravindra and Grieves, Robin. “A New Approach to Determining Optimum Portfolio Mix”. 17ze Journal of Portfolio Management, Vol. 15, No. 3, Spring, 1989.
LeBaron, Dean, Farrelly, Gail and Gula, Susan. “Facilitating a Dialogue on Risk: A Questionnaire Approach”. Financial Analysts Journal, May, 1989.
Leibowitz, Martin L. and Henrikson, Roy D. “Portfolio Optimization Within a Surplus Framework”. Financial Analysts Journal, March, 1988.
Leibowitz, Martin L. and Henrikson, Roy D. “Portfolio Optimization with Shortfall Constraints: A Confidence-Limit Approach to Managing Downside Risk”. Financial Analysts Journal, March, 1989.
Leibowitz, Martin L. and Krasker, William S. ‘The Persistence of Risk: Stocks versus Bonds Over the Long Term”. Financial Analysts Journal, November, 1988.
MarchesRobert F. “How to Select a Consultant for Your Fund”. Financial Analysts Journal, Januaty, 1989.
Michaud, Richard 0. ‘The Markowitz Optimization Enigma: Is ‘Optimized’ Optimal?” Financial Analysts Journal, Januaty, 1989.
Perold, Andre and Sharpe, William. “Dynamic Strategies for Asset Allocation”.
Financial Analysts Journal, Januaty, 1988.
Sharpe, William. “Integrated Asset Allocation”. Financial Analysts Journal, September, 1987.
Statman, Meir and Ushman, Neal L. “Bonds versus Stocks: Another Look”. The Journal of Portfolio Management, Vol. 13, No.2.
Spiedell, Lawrence S., Miller, Deborah H. and Ullman, James R “Portfolio Optimization: A Primer”. Financial Analysts Journal, January, 1989.
Thomas, Lee R “Currency Risks in International Equity Portfolios”. Financial Analysts Journal, March, 1988.
Wood, Arnold S. “Fatal Attractions for Money Managers”. Financial Analysts Journal, May, 1989.
ROBERT ANGLIN
President, Auriga Financial Consultants Inc., Toronto
