While much has been written on the performance of profit-oriented organizations, little is available on the non-profit organization. This paper discusses the relationship between various organizational attributes and measures of performance in 32 Canadian non-profit associations. The research was conducted as part of a week-long workshop for The Canadian Institute for Organization Management in London, Ontario during June 1982. Participants from 16 associations took part in the program and these individuals interviewed a further 16local non-profit organizations.
Measuring Success and Failure
In profit-oriented organizations it is common to find that success and failure are measured in terms of financial criteria, however such measures are usually not appropriate for non-profit organizations (Burnett and Ellis 1982). The most suitable measure of success for all organizations is one related to the degree to which organizational objectives have been met over some suitable planning period. In the case of non-profit organizations it is imperative that such measures be used as no general proxy measures, including profitability, are available. In an ideal situation, a longitudinal study would establish the objectives prior to a planning period, then an objective evaluation could be undertaken at the end of that period. This ideal was not possible in this study as the research had to be completed within one week. Questions were devised to establish, in the opinion of the chief executive officer, the degree to which organizational objectives had been achieved over the preceding planning period. This is very subjective, nevertheless it does provide a measure of the success or failure of the organization, especially if it is used as a relative measure.
In interviewing one another and the CEOs from outside organizations, the participants then assessed the organizational performance with respect to:
(i) overall goal achievement;
(ii) strength of financial resources; (iii) strength of human resources; (iv) strength of physical resources;
(v) overall market performance; and
(vi) any other specified criteria established as significant during the interview.
Finally the interviewer had to take all these variables into account in rating the overall organizational performance on an 11-point rating scale with “bad” as zero and “excellent” as 10. An example of one of the questions and the overall rating scale are shown in Figure 1. (Figures begin on page 27.)
Measuring Organizational Attributes
The attributes of an organization that may influence its performance consist of a wide range of factors including: managerial characteristics, organizational structure and financial variables. An extensive check list was compiled for use in a workshop session in which the objective was to evolve questions on the attributes of non-profit organizations. The check list was constructed from a literature search of the work of recognized researchers in organizational performance. All of their studies were concerned with the performance of profitoriented firms, however the check list was found to be a useful basis for developing a list of questions for research into non-profits. The list is too extensive to be reproduced here but interested readers are referred to the work of Childs (1974 and 1975), Gillingham (1980), Harrington (1979), Kehoe (1983), Schoeffler (1974), and the P.E.P. Report (1965). (For references see page 31.)
All questions on organizational attributes were constructed in such a way as to use an 11-point scale. A typical example of a question is shown in Figure 2.
After development of the questionnaire, the workshop participants interviewed one another and the CEOs of selected local non-profit organizations asking both the organizational attribute questions and the organizational performance questions.
The Results
In a later workshop session the results were analyzed by the work groups. This preliminary analysis consisted of a simple tabulation, a comparison of median scores, a comparison of the proportion scoring more (or less) than a given score, and an interpretation of the results.
These results were used in feedback workshops in which participants attempted to learn how they might improve the performance of their own organizations. Figure 3 provides the attribute profiles of the successful and the failing nonprofit organizations. For the purposes of this exercise, successful organizations were defined as those scoring above the median on the overall organizational performance evaluation; the failing organizations were those below the median.
Mter the program was completed, more extensive analysis was conducted using multiple regression with the organizational performance as the criterion variable and the organizational attributes as the predictor variables. The results from this analysis are shown in Figure 4. The most important positive and negative attributes derived from this analysis are shown in Figures 5 and 6.
Discussion
Most of the results seems to be intuitively sensible although some deserve further comment. The attributes profiles show two attributes where the relatively unsuccessful organizations score a higher median score. These are the extent to which specific programs or services justify funding, and the usage rates of specific programs by members. The explanation for this may lie in the hypothesis that organizations which are too specific to their membership’s isolated needs may miss opportunities to serve other publics.Iftheir funding is also tied to specific programs or services they may be more financially vulnerable.
The positive factors from the multiple regression are highly supportive of the concept that a successful organization has well defined goals, is good at communicating with all publics including government, is responsive to membership and uses its CEO’s time effectively. The negative factors are less intuitively sensible but reflect an impression that failing organizations are too narrow in their focus, use committees to take decisions and are more concerned than their successful counterparts with bureaucratic issues such as keeping committee records.
Overall the results support the pioneering work of the P.E.P. Report (1965) in the profit sector, which portrayed the successful organization as a “thruster” and the failing organization as a “sleeper”. Certainly the study provides supportive evidence for the hypothesis that there is a distinct difference between the attribute profiles of successful and failing organizations.
Conclusion
These attribute profiles can be used by the executives of non-profit organizations to assess the position of their organizations. Areas of possible strength and weakness can then be identified and the management team can consider whether a move towards the profile of successful organizations would be likely to improve performance.
This research study provides evidence that diagnostic models of non-profit organizations can be built. The results also provide support for the behavioural and managerial theories concerning organizations and there can be little doubt that the performance of the non-profit organization, like that of those whose aim is profitability, is influenced by a number of organizational and managerial factors.

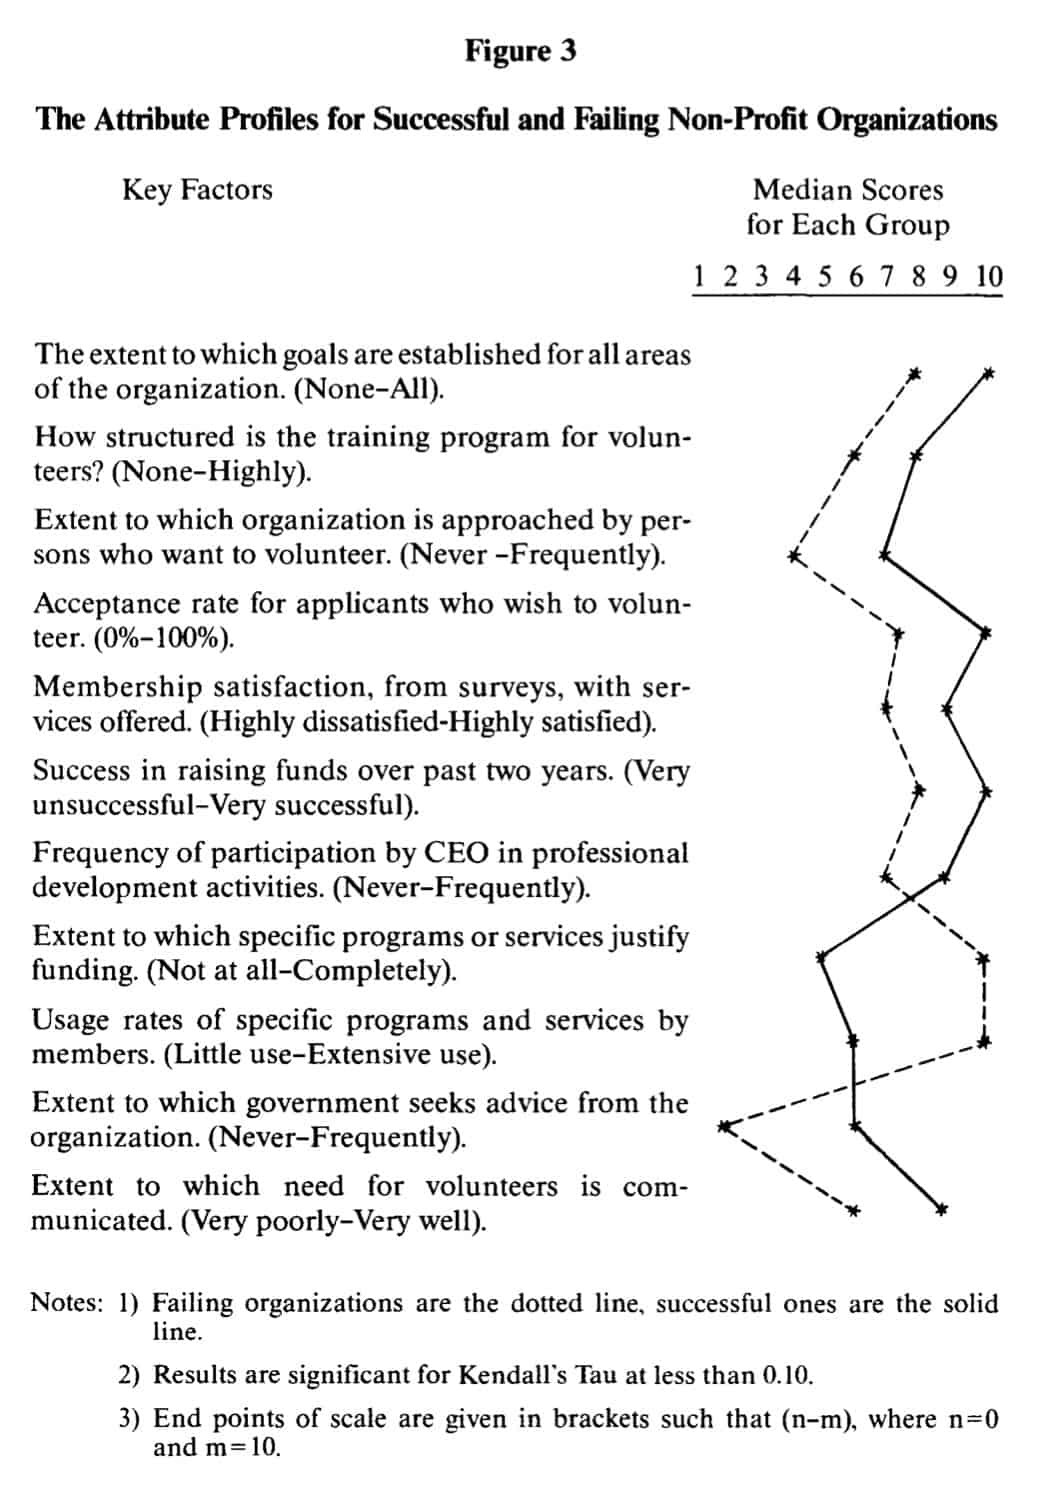
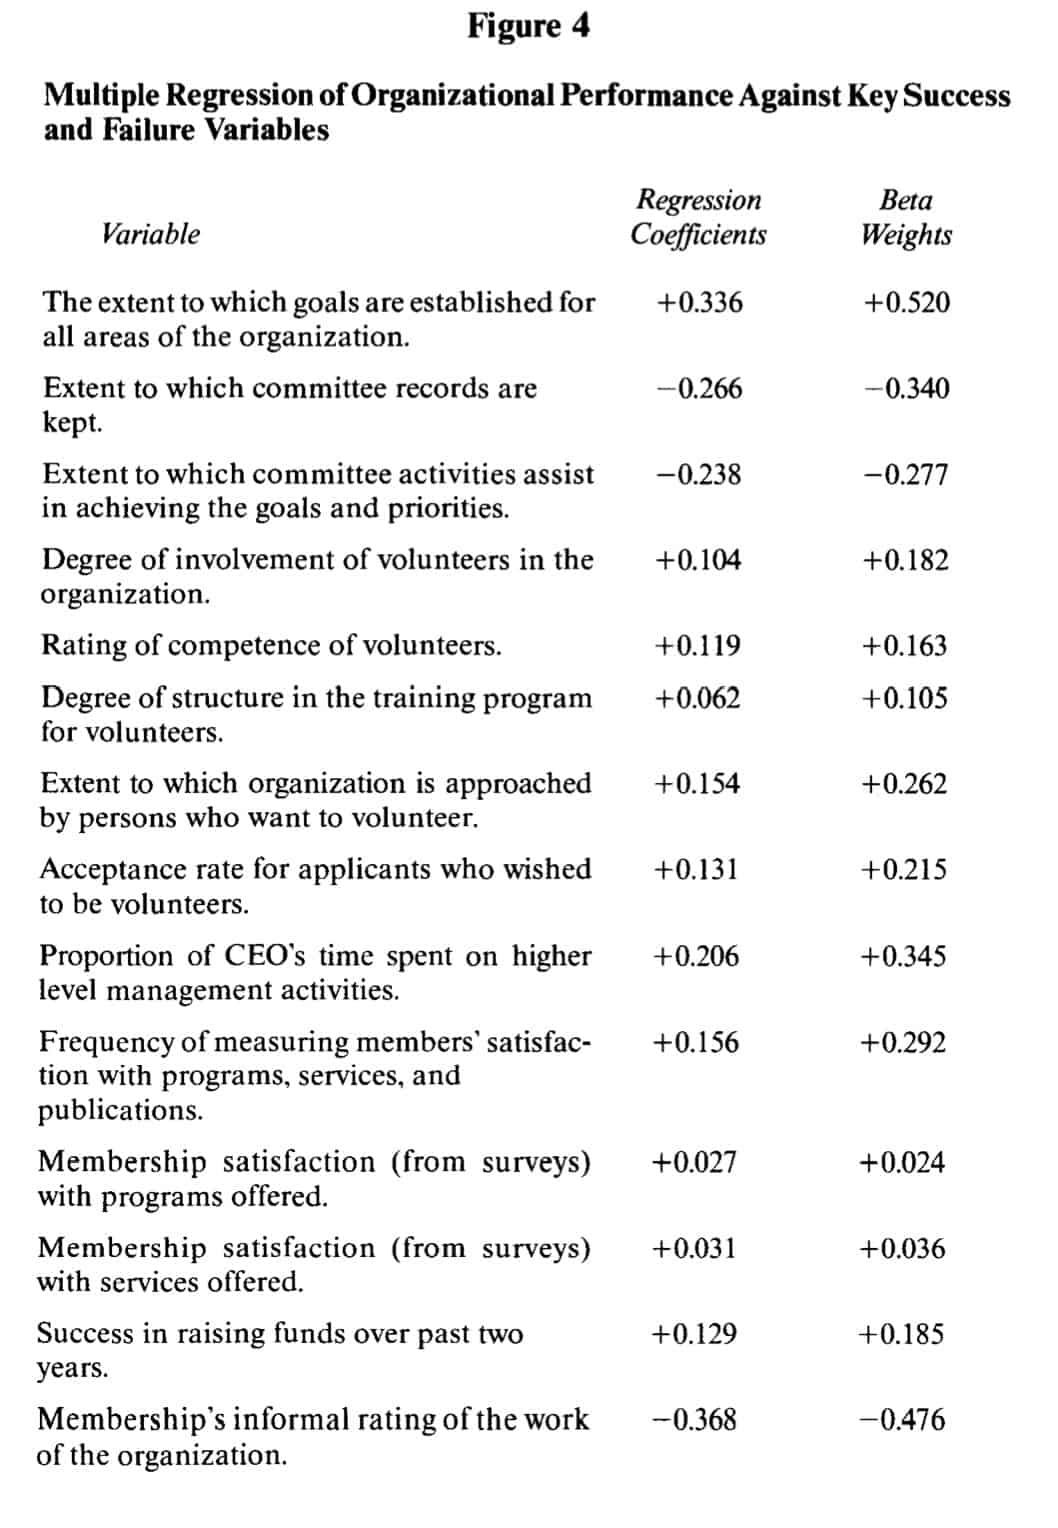
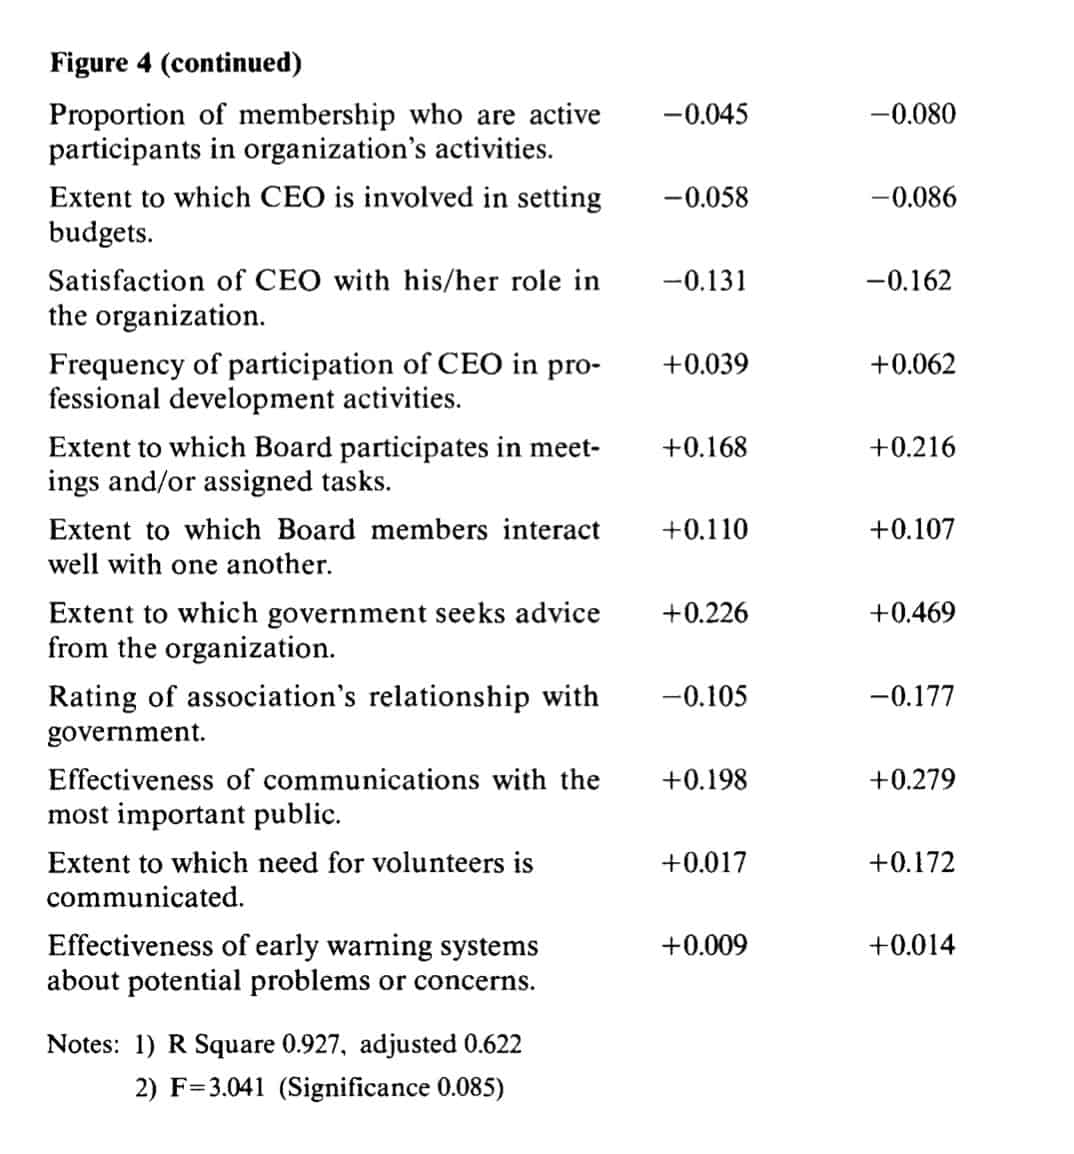
Figure 5
Most Important Positive Factors in Rank Order of Beta Weights
Higher scores on:
1. The extent to which goals are established for all areas of the organization.
2. Extent to which government seeks advice from the organization.
3. Proportion of CEO’s time spent on higher level management activities.
4. Frequency of measuring members’ satisfaction with programs, services, and publications.
5. Effectiveness of communications with the most important public.
Figure 6
Most Important Negative Factors in Rank Order of Beta Weights
Higher scores on:
1. Membership’s informal rating of the work of the organization.
2. Extent to which committee records are kept.
3. Extent to which committee activities assist in achieving the goals and priorities.
REFERENCES
Burnett, Edward and Williard, Ellis. ‘The Human Side of Entrepreneurship”, Proceedings of the International Council for Small Business-Canada, Edmonton, April, 1982.
Childs, John.”Managerial and Organizational Factors Associated with Company Performance-Parts I and II”,Journal of Management Studies, October, 1974 and February, 1975,175-189:12-27.
Gillingham, David. “A Comparison Between the Attribute Profiles of Profitable and Unprofitable Companies in the United Kingdom and Canada”, Management International Review, 1980, 20:4, 64-73.
Harrington, L.T. and Hodgson, G. ”Management Policies and Practices and Business Performance”, Colchester: The Centre for Interfirm Comparisons, October, 1979.
Kehoe, W.J. “Strategic Marketing Planning and the PIMS Model”,Advanced Management Journal, 1983,48:2,45-52.
Schoeffler, S., Buzzell, R.D. and Heaney, D.F. “Impact of Strategic Planning on Profit Performance”, Harvard Business Review, March/April, 1974, 137-145.
P.E.P. Report. ‘Thrusters and Sleepers’; London: Allen and Unwin, 1965.
DAVID W. GILLINGHAM
Director, School of Commerce and Administration, Laurentian University
LOUIS R. ZANIBBI
Associate Professor, School of Commerce and Administration, Laurention University