A. Introduction
A major concern of most charitable organizations is increasing the annual value of contributions received. A necessary part of achieving this objective may consist of acquiring information on the characteristics of families who give or who do not give to charity in Canada. For example, if fund raisers know that families with certain characteristics (particular income levels, certain levels of education, specific occupations, etc.) tend to give more, they may find it profitable to direct their solicitations to those people. For this reason, information on the family characteristics associated with charitable giving may be of great value to charitable organizations.
This second article differs from my earlier article (The Philanthropist, Spring 1986, Vol. Vl, No.1, pp.3-33) in that it deals only with the family characteristics associated with contributions to religious causes whereas the earlier article looked at the family characteristics associated with all charitable contributions. In addition, the information presented in the earlier article included all Canadian families, i.e., those who contributed and those who did not. The information in this article includes characteristics associated only with families who contributed money (any amount greater than zero) to religious charities.
The data employed in this paper were extracted from the Statistics Canada microdata tape 1982 Survey of Family Expenditures which contains data collected from its Survey ofFamily Expenditures in 1982. All computations on this data were done by the author of this paper and data presented are weighted (according to Statistics Canada weights) so as to generate results which are representative of all families in Canada, in total, and by region.
The material in this paper is descriptive and non-analytical. For instance, the relationship between religious contributions by family and a number of family characteristics is compared across income groups and across regions.
B. Relative Size of the Contributing Sector
Given that the total level of contributions to religious organizations depends on both the participation rate (percentage offamilies who give) and the level of contributions made by each contributor, it may be of some interest to review each of these components in turn.
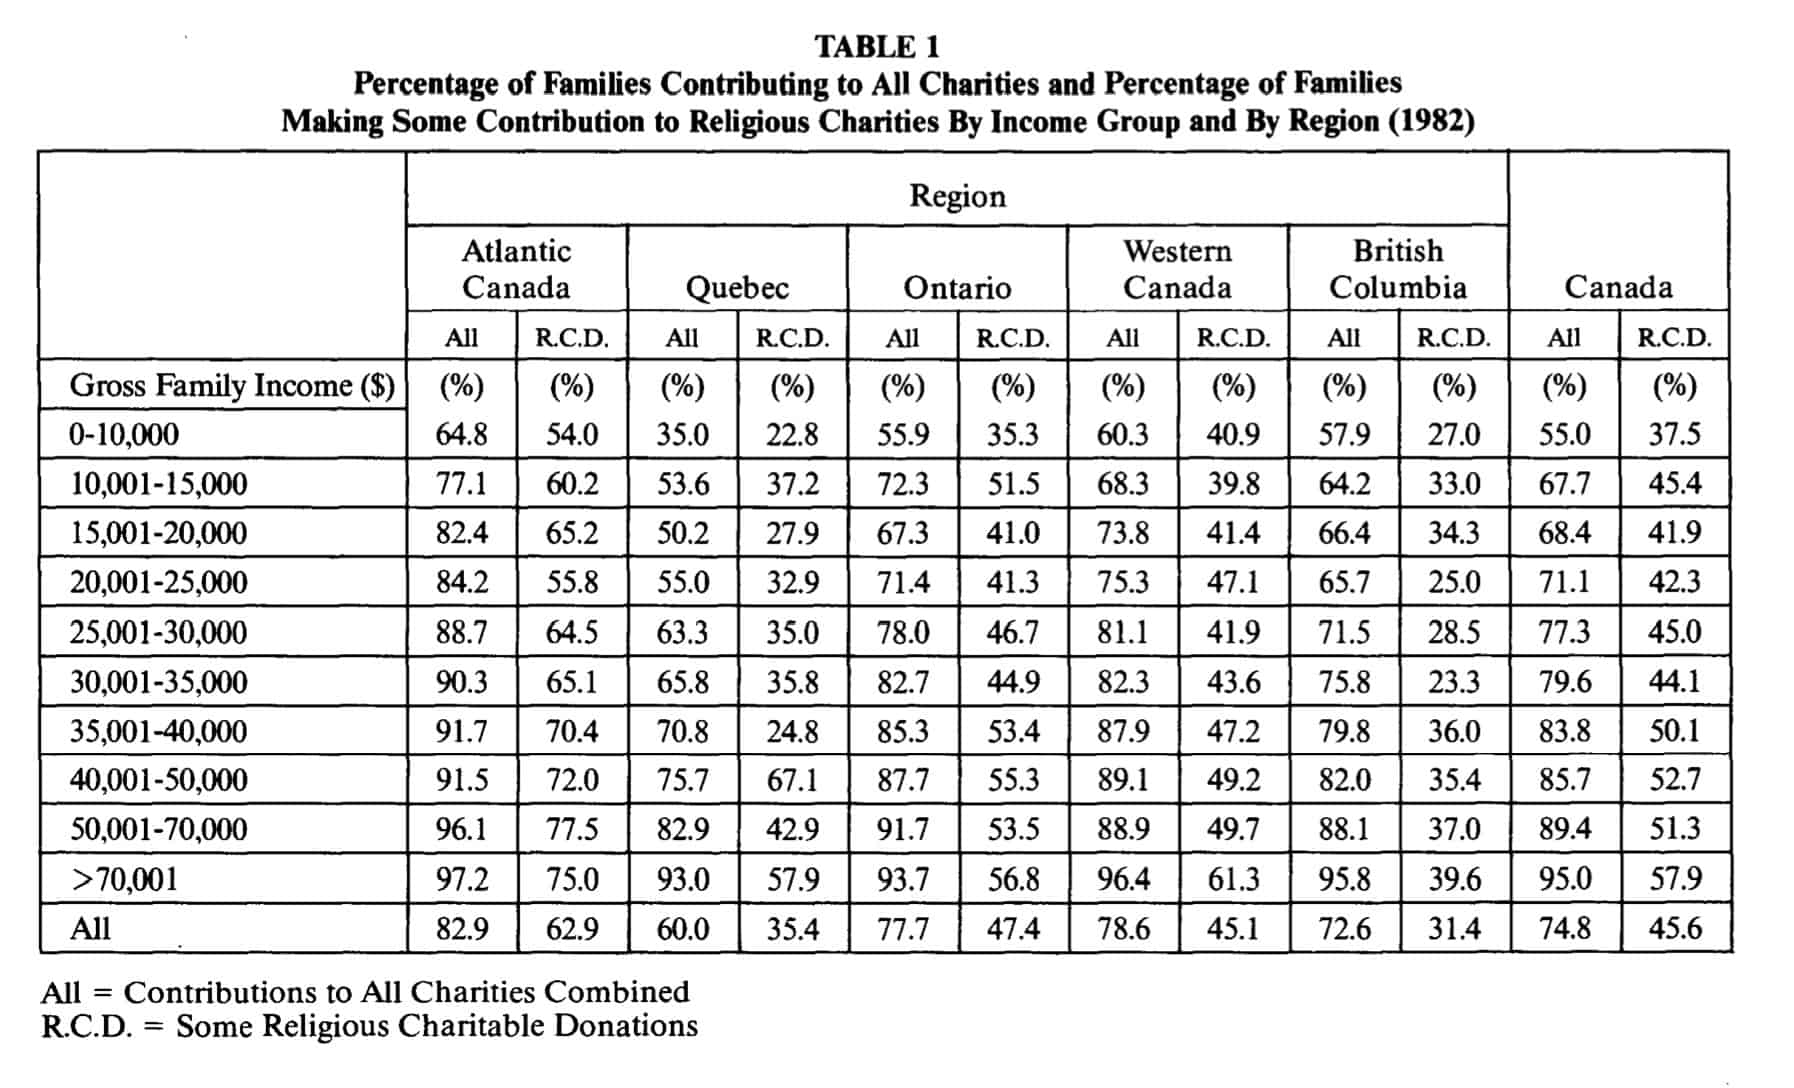
Table 1 records the participation rates by region for all families giving to all charitable organizations combined and for families contributing only to religious organizations. The first column under each regional heading lists the percentage of all families within each income group who made charitable donations to charitable organizations (all charities combined). For Canada, it will be seen that almost 75 per cent of all families (final row of second last column) contribute to some type of charitable organization. Regionally, this percentage ranges from a low of 60 per cent in Quebec to a high of83 per cent in Atlantic Canada. In all regions a smaller percentage of families at the lower end of the income scale than of families at the upper end contribute to charitable organizations. This is not surprising in view of the relatively larger tax savings associated with donations by those with higher incomes and the fact that those with higher incomes usually have more discretionary income.
The second column under each regional heading records the percentage of all families making religious contributions (exclusively or in combination with other giving). The figures are noticeably lower than the corresponding figures in the preceding column (i.e., those who contribute to all charitable causes). In Canada, slightly more than 45 per cent of all families gave to religious causes in 1982. Once again, the regional variation extended from Atlantic Canada where almost 63 per cent of all families donated to religious causes (the highest) to 31 and 35 per cent in British Columbia and Quebec, the two lowest.
The differential between the two columns under each regional heading reflects the percentage of families who contributed to charitable causes other than religion. In British Columbia, for example, the differential between the percentage of families who contributed to some kind of charity in 1982 (72.6 per cent) and those who made some or all of their contributions to religious activities (31.4 per cent) is greater than in any other region. This differential of 42.2 percentage points covers the number of families who gave all of their donations to other than religious activities. By comparison, this differential in Atlantic Canada is lower than in any other region (a differential of20 percentage points-82.9 per cent minus 62.9 per cent). The other regions displayed differentials of 24.6, 30.3 and 33.5 percentage points in Quebec, Ontario and Western Canada, respectively.
Across all income groups within each region there is some variation in the percentage of families who contribute to other than religious causes (as reflected in the difference between the figures in the two columns under each region). For example, the percentage of families contributing to religious charities increases as family incomes increase but it is also true that as incomes go up, the percentage of these families giving to other than religious charities also increases. (This is reflected in the difference between the percentage figures in the two columns under each regional heading.)
C. Religious Charitable Donations By Income Level, As a Percentage of Family Income and By Region
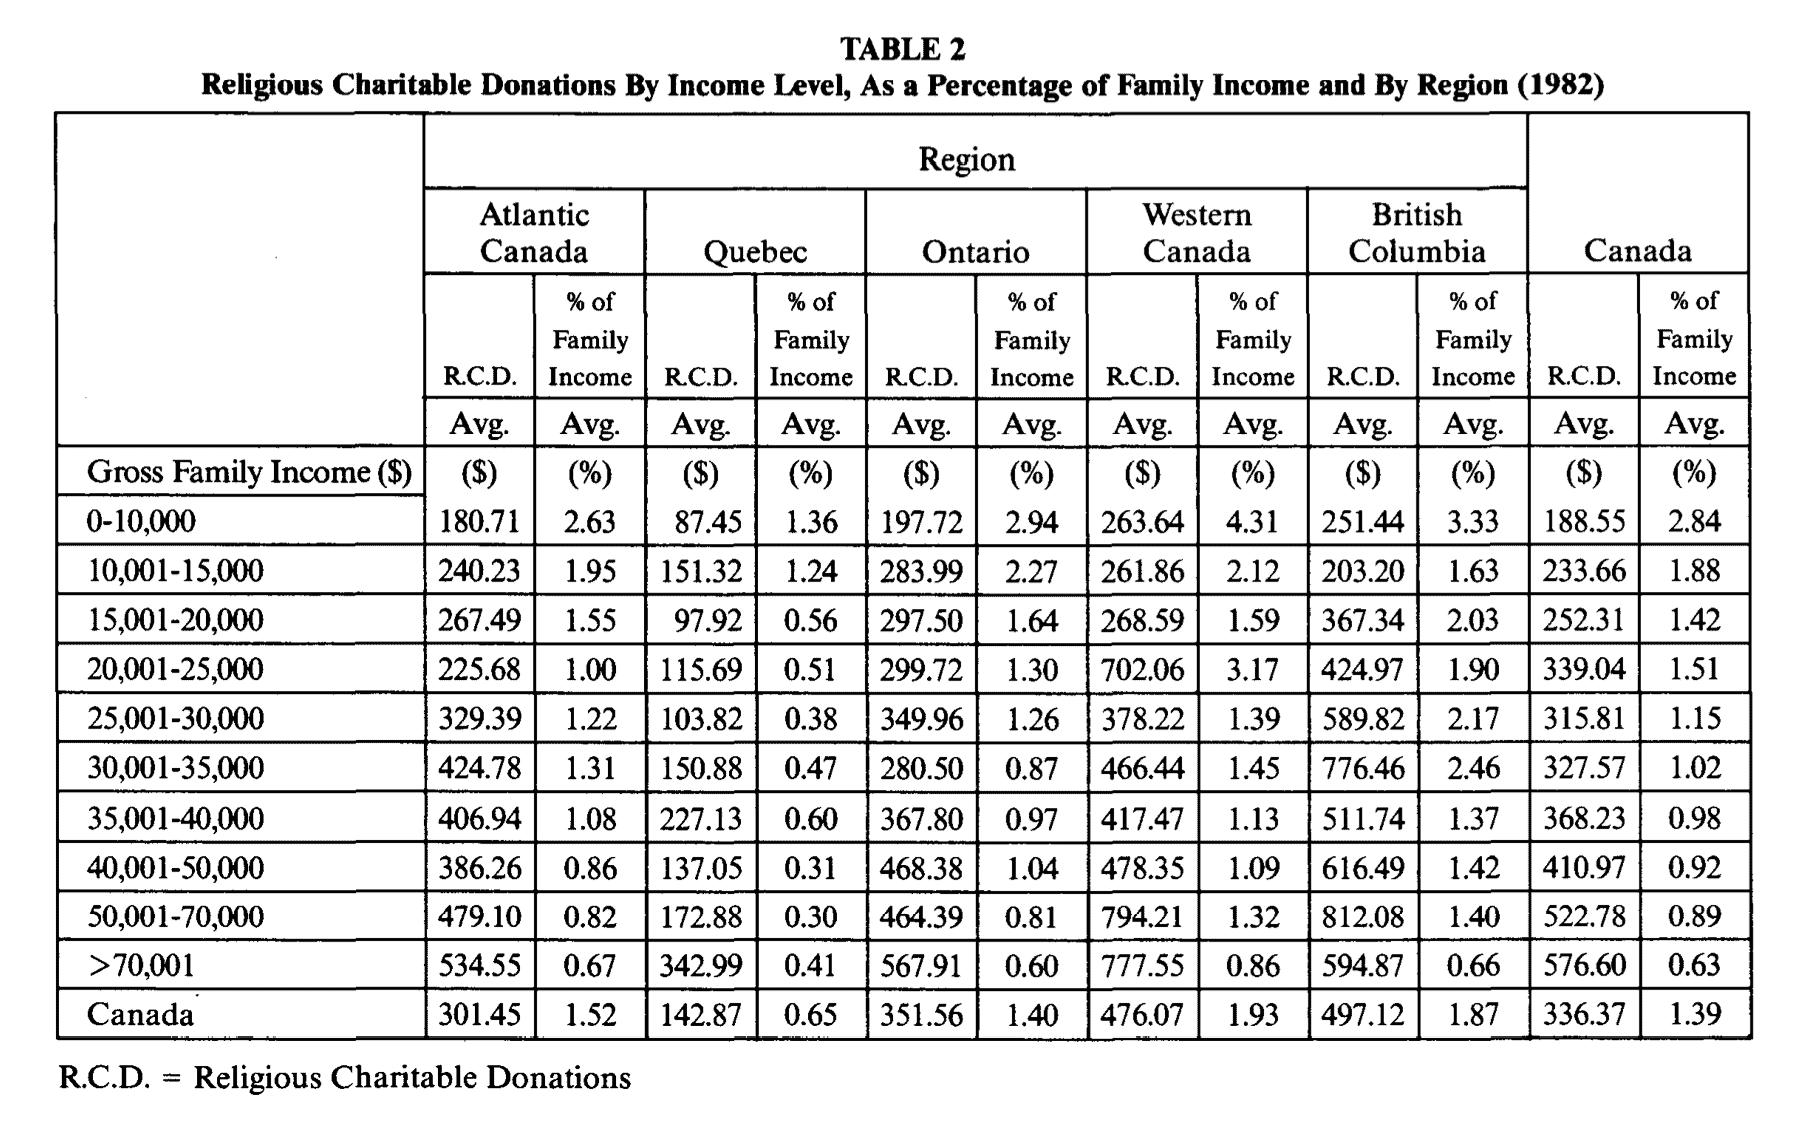
While Table 1 records participation rates by region, Table 2 records the average family contribution by income group and this contribution as a percentage of family income (on average).
Table 2 presents some interesting information. The participation rate in British Columbia (Table 1), for example, is lower than for any other region (in fact, it is 31 per cent below the Canadian average), yet the average family contribution for those who did contribute ($497.12) is higher than the average elsewhere in the country and is almost 48 per cent above the Canadian average. Families in Atlantic Canada reported the highest participation rate, yet the average size of their contributions ($301.45) was 10 per cent below the Canadian average. Quebec, whose participation rate was the second lowest (35 per cent overall) also reports the lowest average family contribution ($142.87). The average in Western Canada and Ontario, whose participation rates were almost identical to the Canadian average, exceeded the Canadian average family contribution by 42 per cent and four per cent respectively. Not surprisingly, and regardless of the region in which the family lives, the contribution level varies directly with family income.
Table 2 also records religious charitable donations as a percentage of family income. Families in Western Canada, on average, gave 1.93 per cent of their family incomes to religious causes. They were followed by families in British Columbia (1.87 per cent), Atlantic Canada (1.52 per cent), Ontario (1.40 per cent) and Quebec (0.65 per cent) in descending order of magnitude. In each region, contributing families at the lower end of the income scale gave proportionately more than contributing families at the upper end.
D. Religious Charitable Donations By Age of Head of Household and By Region
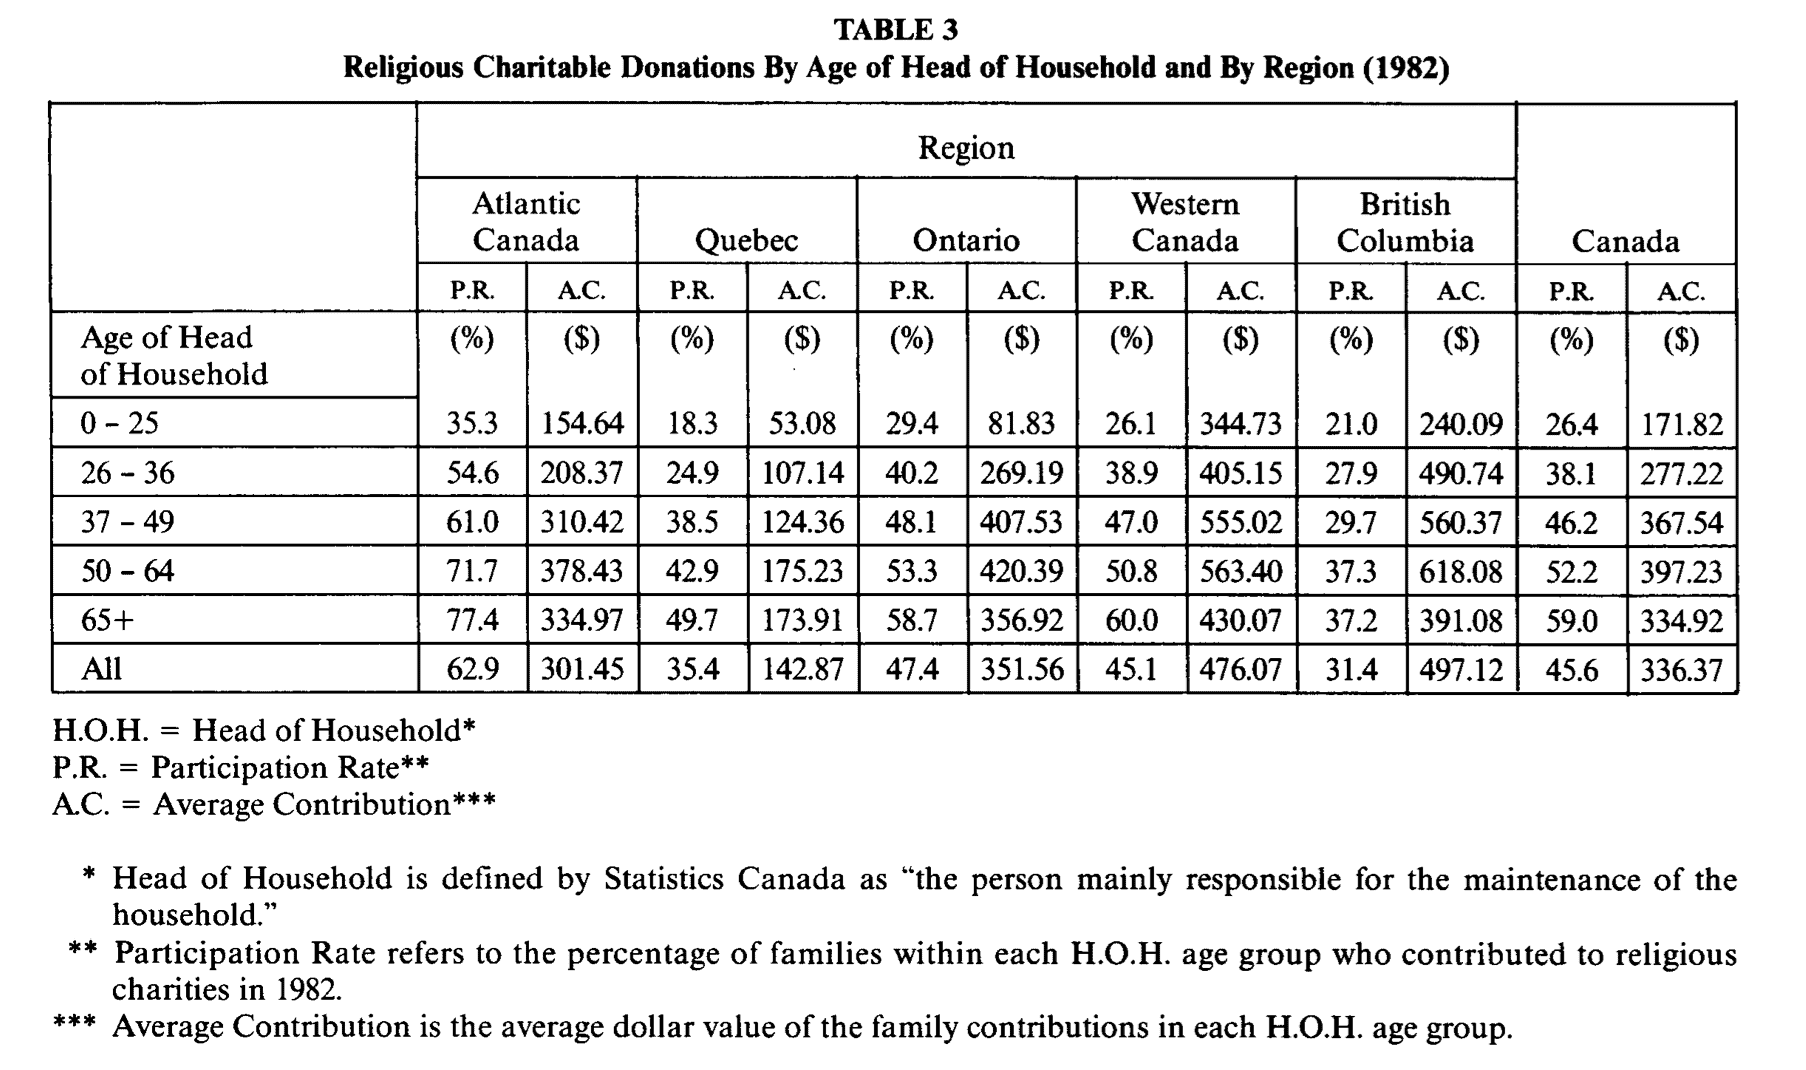
Table 3 reports the participation rates and the average size of contributions of families in terms of the age of the head of household and by region.
For Canada as a whole and for each separate region, the participation rate increases initially as the age of the head of household increases. In each geographical area, the average size of the family contribution increases up to the H.O.H. age of 64 and then decreases for families whose H.O.H. is 65 or over. This result is not surprising in viewof the relatively lower incomes of the highest age group.
What does appear to be surprising in this table is the fact that although British Columbia families displayed the lowest participation rate (31.4 per cent) those who did contribute had the highest overall level of contributions ($497.12 per family). In fact, this exceeded the average for Canada ($336.37 per family) by almost $161 per family. By way of comparison, contributions in Western Canada, where the participation rate was roughly equal to the Canadian average (45 per cent), contributed almost $140 more ($476.07 per family) than the average for all of Canada.Contributing families in Quebec (where the partipation rate was lowest) were also at the lowest end of the contributions scale. In 1982 they gave, on average, $142.87 per family to religious charities. The remaining two regions fell between these extremes.
E. Religious Charitable Donations By Education Level of Head of Household and By Region
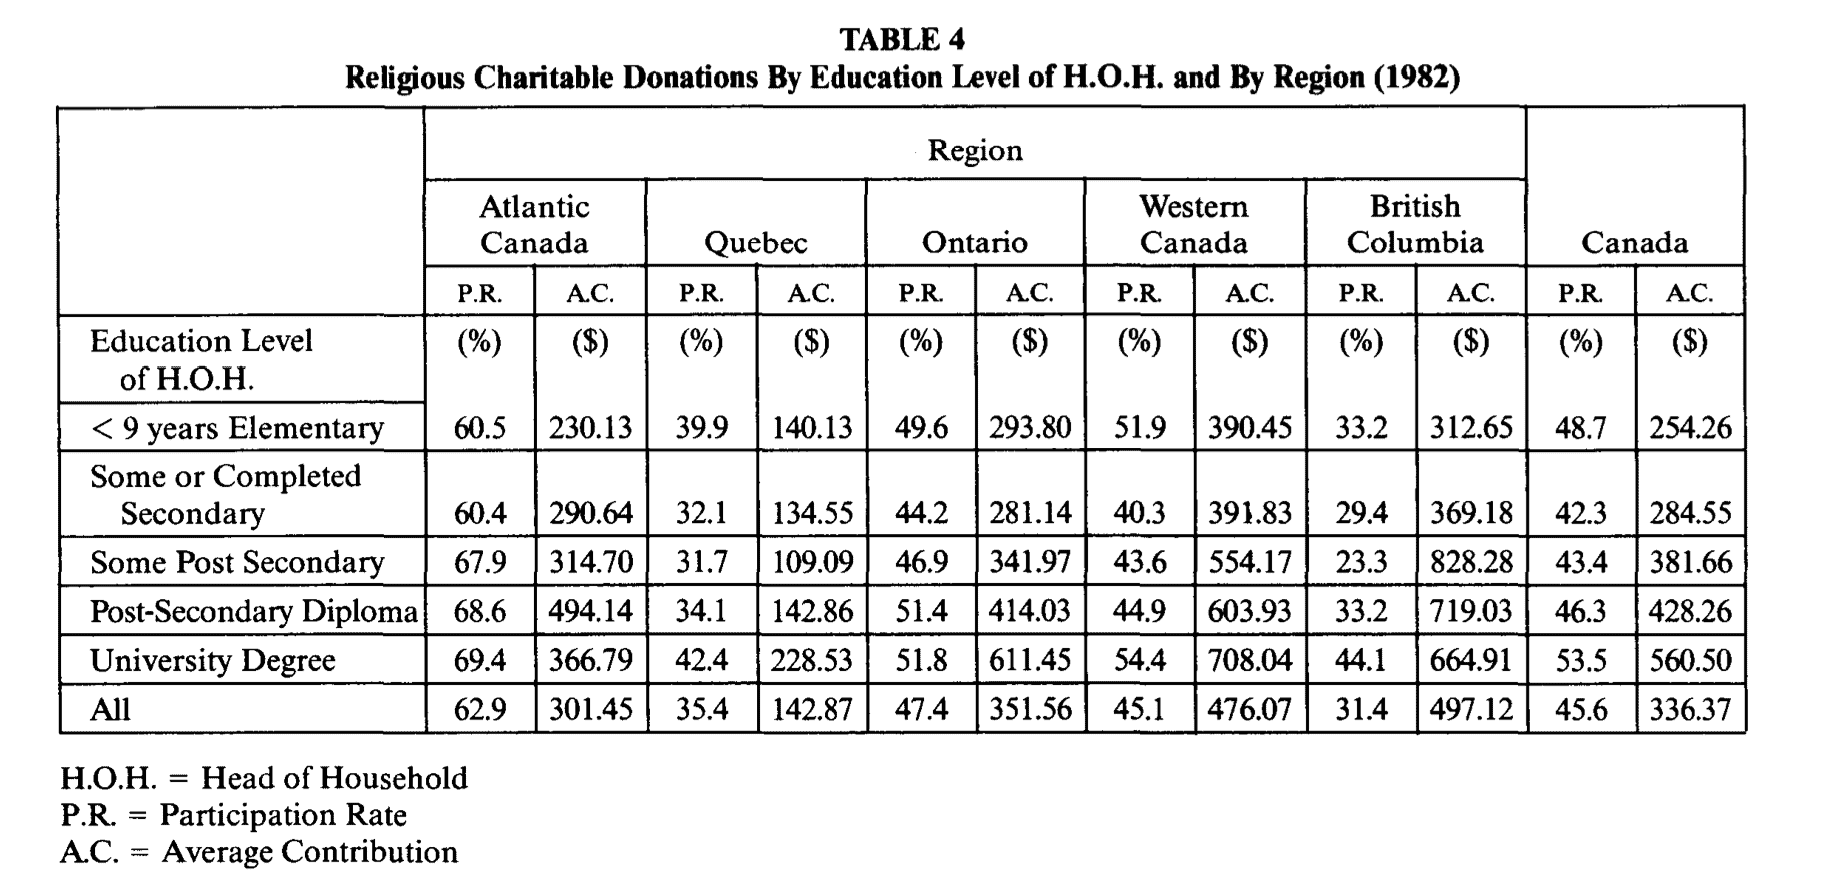
While the percentage of families who donate to religious charities in all regions does not show a lot of variation related to the level of education achieved by the head of the household (it ranges from 42 to 53 per centsecond last column of Table 4), the actual level of the contribution does increase as the level of education increases (last column of Table 4). In fact, with some minor deviations, this pattern is similar, although the absolute value of the numbers differs, for each of the regions surveyed. (Table 4 illustrates these patterns.)
F. Religious Charitable Donations By Sex of Head of Household and By Region
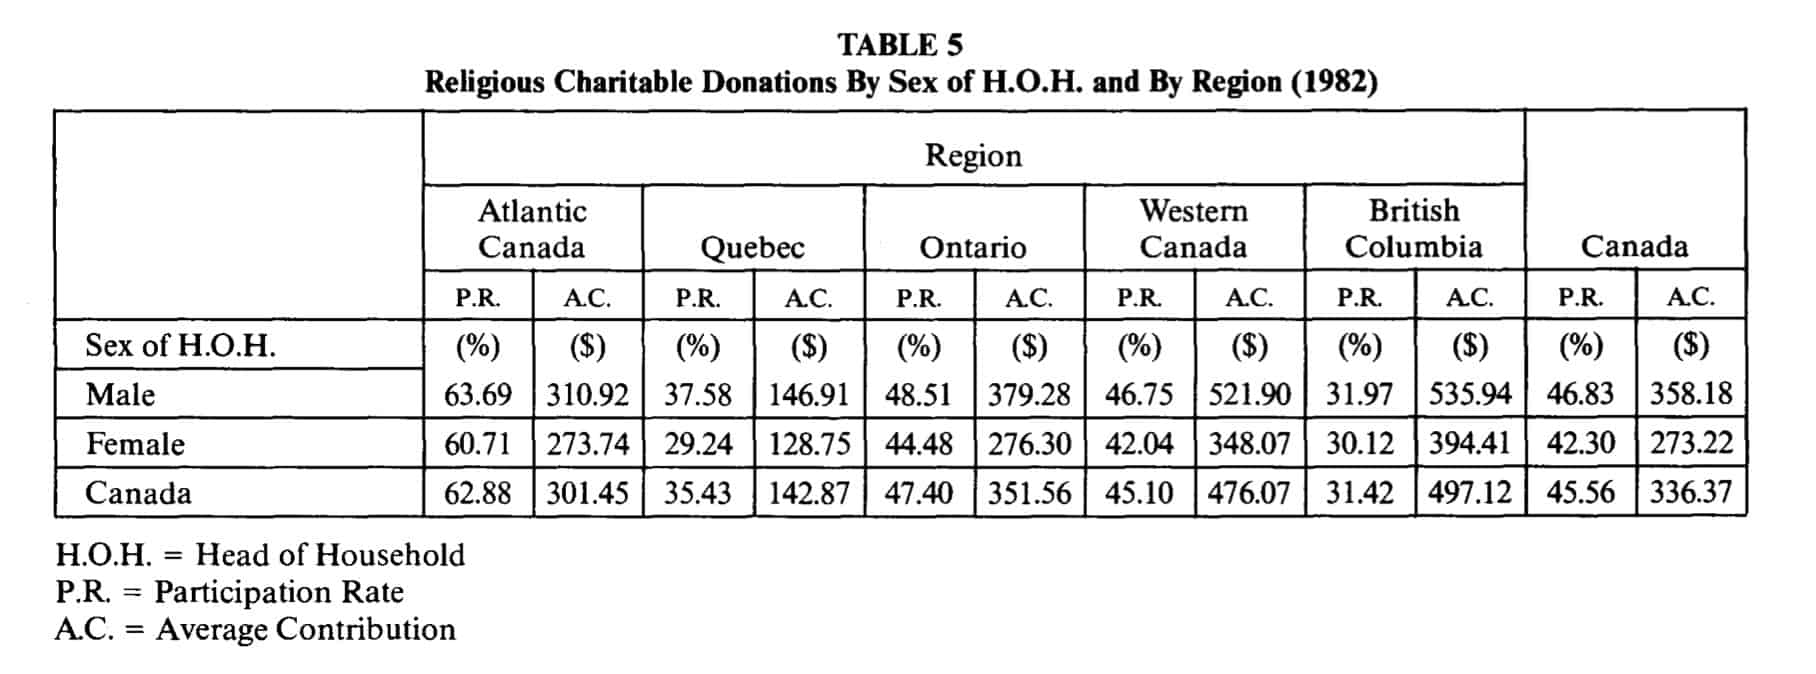
While the participation rate for households headed by males is only slightly higher than that of households headed by females, the average family contribution of households headed by males tends to be higher by a greater proportionate amount (Table 5). For example, the participation rate for male-headed households in Canada is almost 47 per cent, whereas the female-headed households’ participation rate is just over 42 per cent. However, with the exception of Quebec (where the differential is almost nine percentage points), the differential in the participation rates according to the sex of the head of household is less than five percentage points in each region.
A comparison of the size of average family contributions indicates a differential of $85 per contribution ($358 for male-headed households and $273 for female-headed households for all of Canada). Regional differentials range from a low of$14 per contributing family in Quebec ($147 for male heads and $129 for female heads) to a high of$173 in Western Canada. (See Table 5 for more detail.)
G. Religious Charitable Donations By Mother Tongue of Head of Household and By Region
Perhaps the greatest degree of regional variation is noted in the comparison of participation rates as related to the mother tongue of the head of the household (Table 6). In all of Canada, nearly 52 per cent of the families where the mother tongue of the head ofhousehold was other than English or French, gave to religious charities in 1982. By comparison, 46 per cent of families where the mother tongue of the head of household was English contributed to religious causes while just under 40 per cent of families where the mother tongue of the head of household was French gave to similar activities.
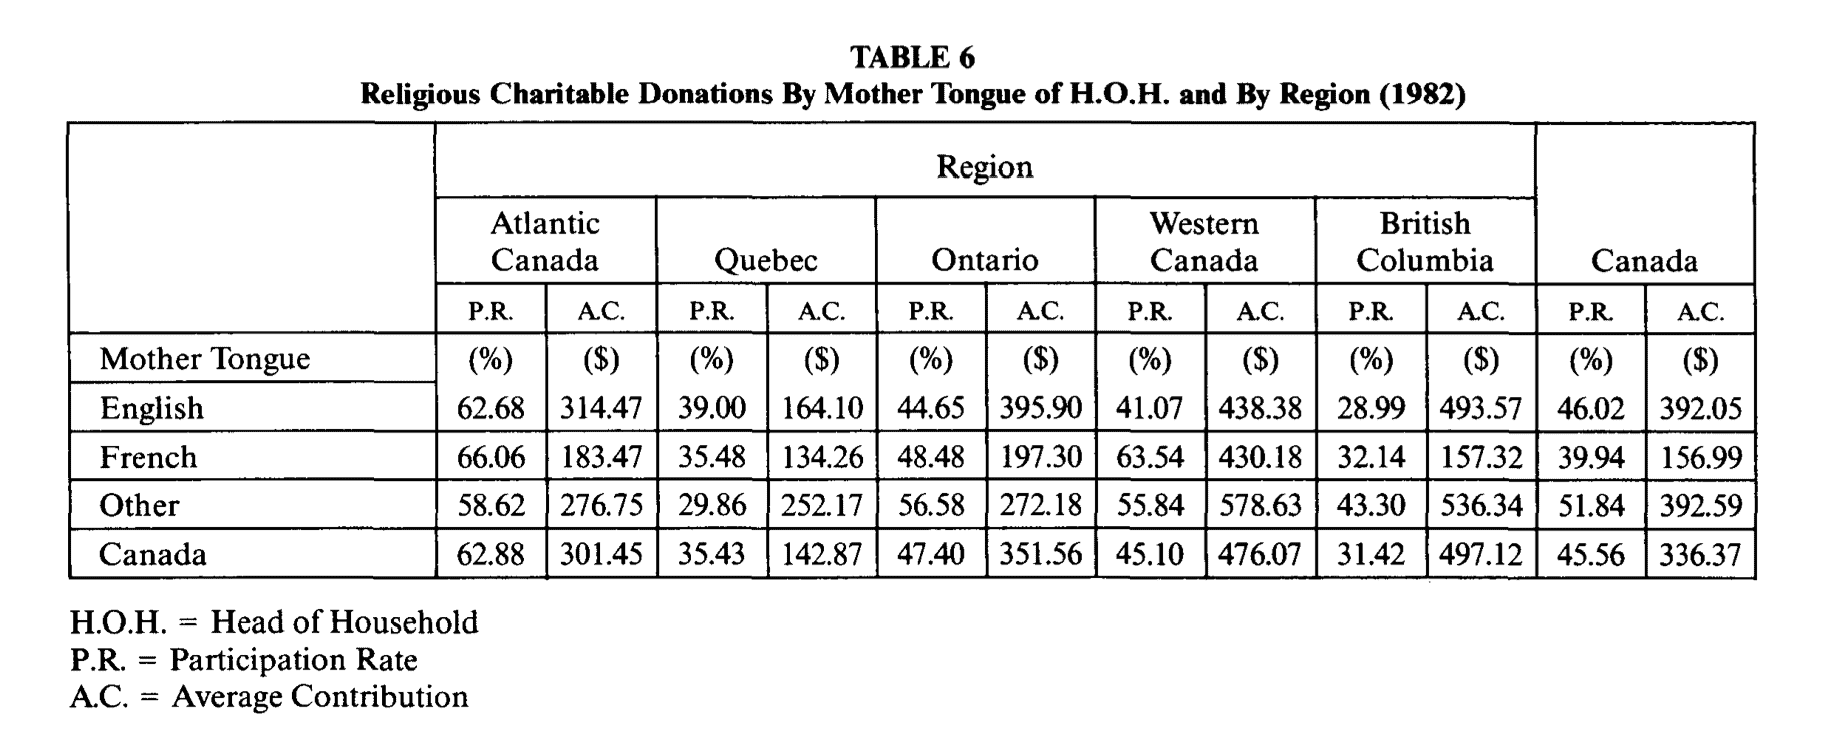
On a regional basis, the variation is quite noticeable: for example, in Atlantic and Western Canada, higher participation rates were noted for families where the mother tongue of the head of household was French. In Quebec, the participation rate was highest for families where English was the mother tongue of the head of household. In Ontario and British Columbia, the “other” category had the highest participation rates.
Average family contributions for all of Canada amounted to $392 for families where the mother tongue of the head ofhousehold was classified as English or “other”. For families where French was the mother tongue of the head of household, the average contribution was $157 (40 per cent of the average for English and “other”). In every region, when the mother tongue of the head of household was French, the families gave less, on average, than either of the other two categories. In Atlantic Canada and Ontario, families whose head of household had the mother tongue “English”, on average, gave more than the others; families in the “other” classification gave more in Quebec, Western Canada and British Columbia (see Table 6).
H. Religious Charitable Donations By Occupation of Head ofHousehold and By Region
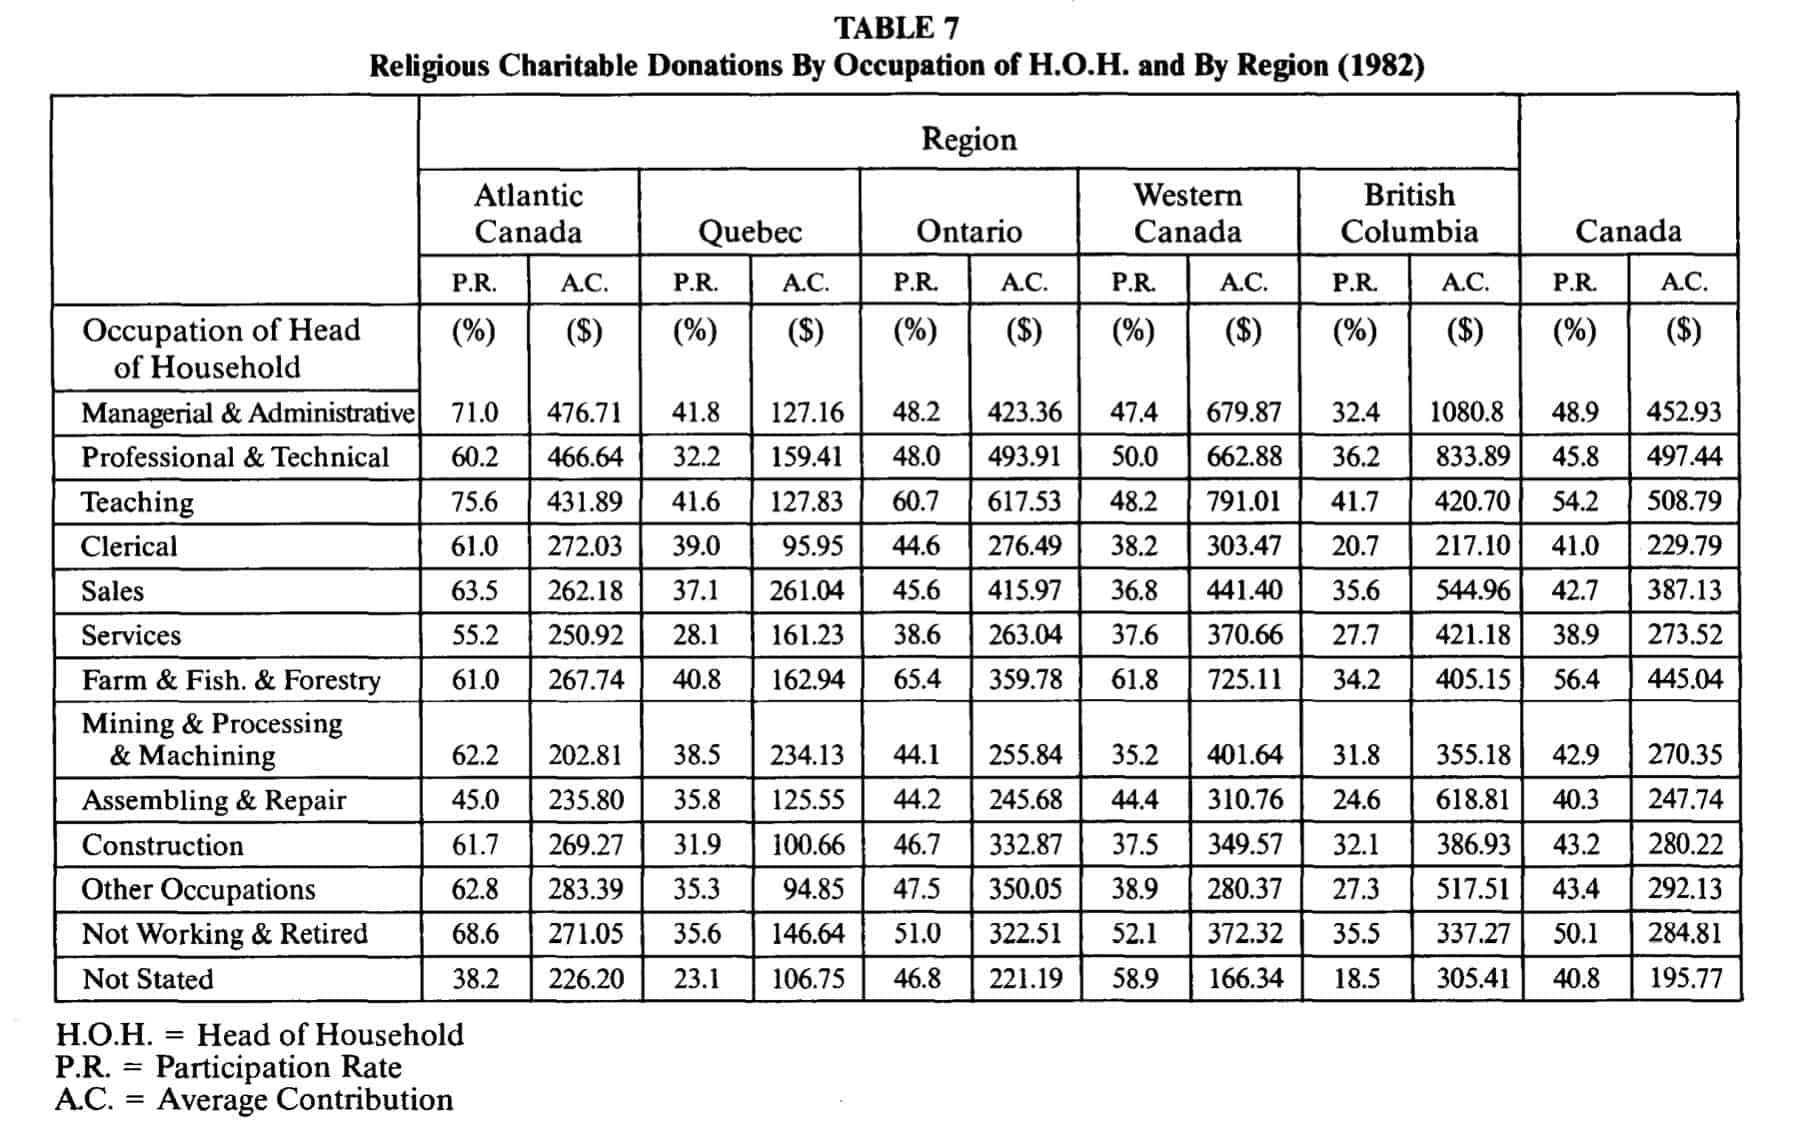
Table 7 records the participation rates and the average contribution for families whose head ofhousehold is employed in one of 13 occupational groupings. In Canada as a whole, only three of these occupational groupings exhibited a participation rate in excess of 50 per cent. These included farming, fishing and forestry workers at 56.4 per cent; the teaching profession at 54.2 per cent; and the not working or retired group at 50.1 per cent. The assembling and repair occupational group recorded the lowest participation rate at 40.3 per cent. While there is some variation in the relative ranking of participation rates by occupational groupings in each of the regions, most regions follow the national pattern (see Table 7).
Considerably more variation is observed in the average level of family contributions across occupational rankings. Although there are some regional differences, primarily in Quebec and British Columbia, the three occupational groups consisting of managerial and administrative, professional and technical, and teaching tend to contribute larger amounts per family.
I. Religious Charitable Donations by Type of living Quarters and By Region
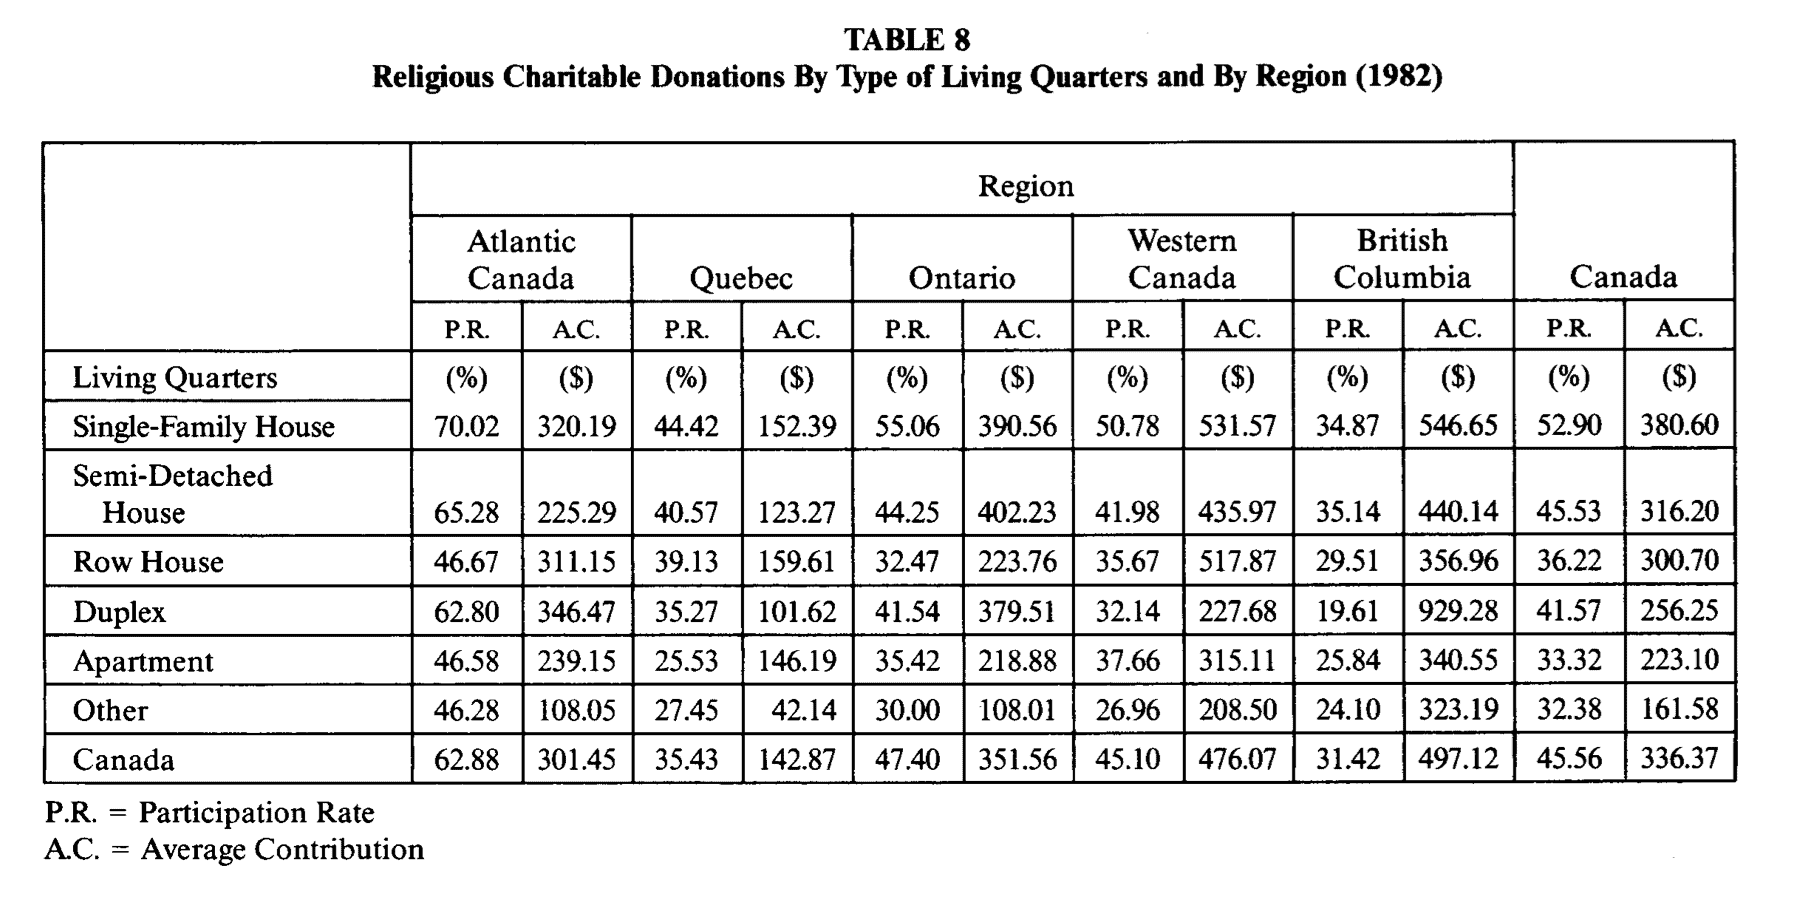
While there is some regional variation in both the participation rate and the average family contribution when families are grouped according to their type ofliving quarters, either the participation rate or the average family contribution (and in many cases both), tend to be highest among families living in single-family detached houses. The exception is British Columbia where the highest average contribution is made by donating families living in duplexes and the highest participation rate is among families living in semi-detached houses (see Table 8).
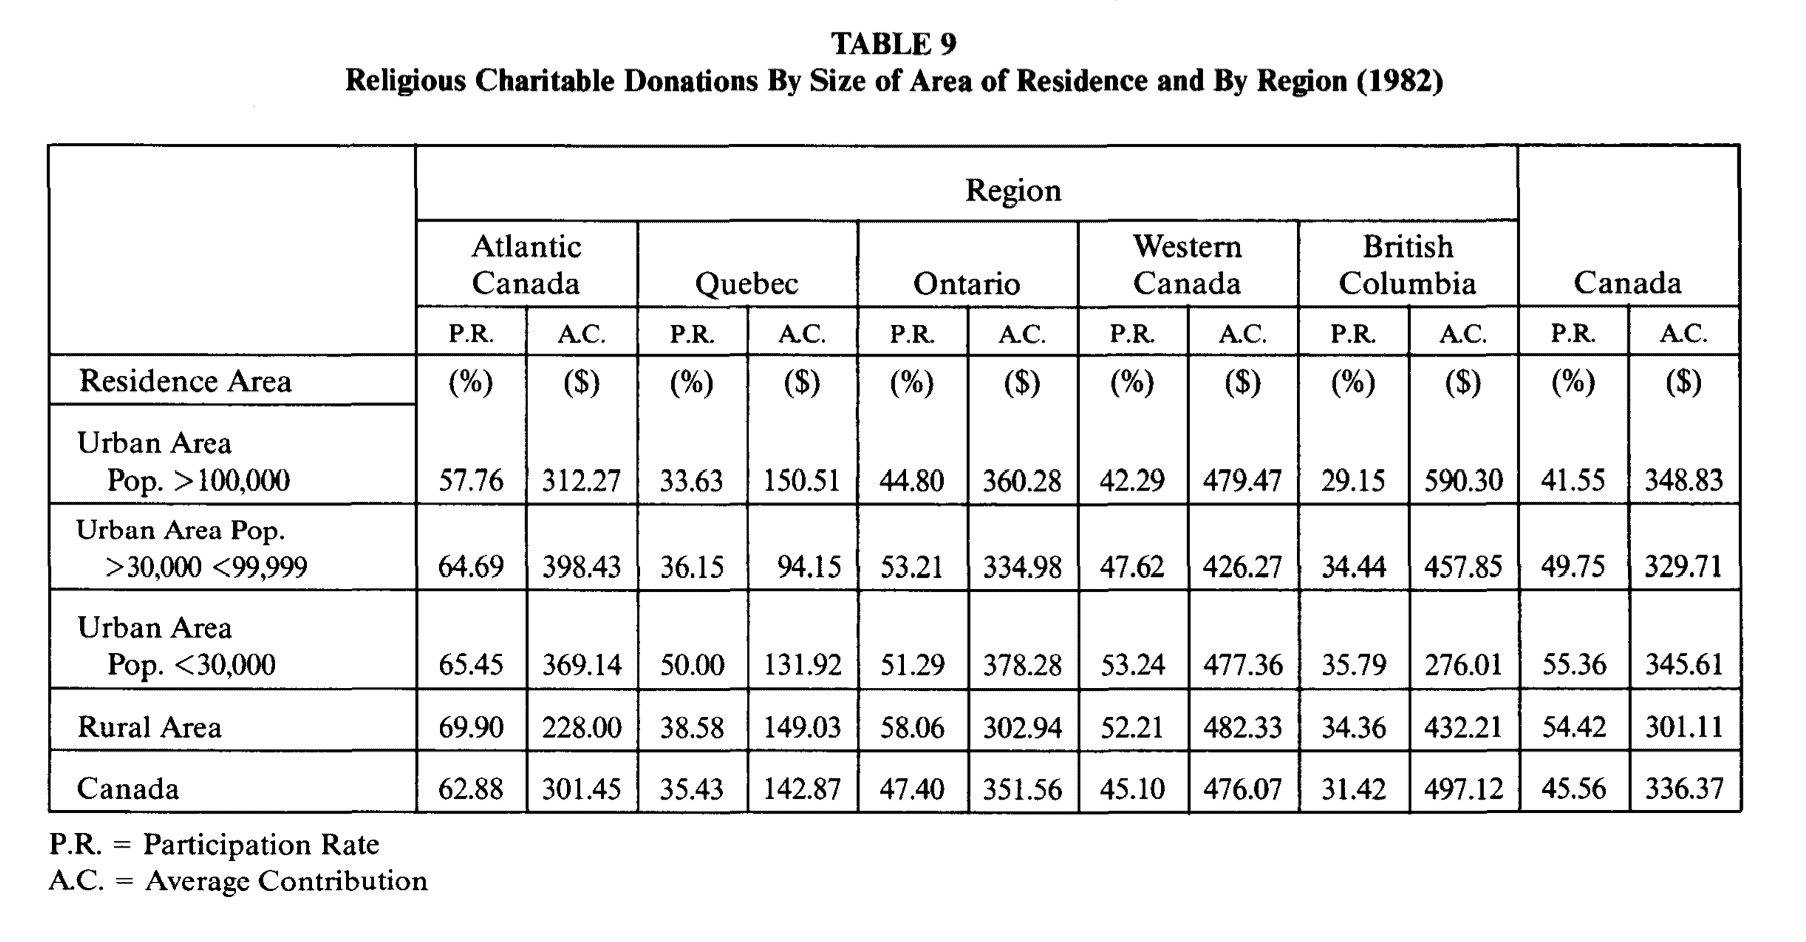
J. Religious Charitable Donations By Size of Area of Residence and By Region
Table 9 reports the participation rates and average family contribution according to location of residence, i.e., whether the contributing family lived in a large urban area, a small urban area or rural area. Once again, regional differences exist, but the tendency is for participation rates to be higher in rural and small urban areas rather than large, urban areas. In most regions, on the other hand, the average family contribution is higher in the urban areas than it is in the rural area, a result that is not likely to surprise many (Table 9).
K. Summary
It was the intention of this paper to present some data on the relationship between religious charitable donations and certain socio-economic and demographic characteristics associated with either the head of household or the family as a whole.
Using the data from the 1982 Survey of Family Expenditures this paper has shown certain patterns across income groups and across regions. The reader must understand, however, that no explanation of such patterns has been attempted; the paper is intended to be descriptive rather than analytical. As well, the absolute values for the results obtained in this paper cannot be compared directly with those in my earlier paper which dealt with all families and all charitable donations. In the earlier paper, intra- and inter-regional comparisons were made by including all families (i.e., those who contributed some amount to charity along with those who contributed nothing); this paper notes the participation rate and the average level of contributions to religious causes for charitable donors only, when they are arranged by some selected family characteristics.
Very briefly, there are a few salient features which have emerged from this presentation. First, in most regions, the percentage of families contributing to religious charities (either separately or in combination with donations to other charities) is noticeably smaller than the percentage of families contributing to charities as a whole. For example, roughly 20 per cent of the families who made contributions to charity in Atlantic Canada did not contribute to religious causes. In the other regions, the corresponding percentages were 25 in Quebec, 30 in Ontario, 33 in Western Canada, and 41 in British Columbia.
Second, in every region, religious charitable donations absorbed a higher percentage of the income oflower income families than of higher income families and the average family contribution tended to be highest in Western Canada and British Columbia and lowest in Quebec.
Third, in general, the older the head of household, the higher the participation rate. The average level of contributions tended to rise as the age of the head of the household increased up to the age of 65, at which point the average contribution declined.
Fourth, the participation rates for families where the head of household had less than nine years of elementary education or at least one university degree (the two extremes) tended to be higher (although some regional variation did exist) than the rates for families where the head ofhousehead fell in the other educational groupings. As well, the average contribution level increases with the level of educational achievement.
Fifth, when compared with families with female heads of household, families with male heads of household displayed (on average) both higher participation rates and higher average family contributions in all regions.
Sixth, although the participation rate, for all of Canada is highest for families where the mother tongue of the head of household is other than English or French and lowest where it is French, considerable regional variation exists in the comparative ranking of the three categories (English, French and Other).
Seventh, the variation in participation rates across occupational groups is not as significant as the variation in the absolute size of the contribution per family in these groupings.
Eighth, both the participation rate and the average family contribution tend to be higher in families living in single detached homes as compared to families living in other types of dwelling.
Ninth, families in small urban and rural areas have a greater tendency to contribute to religious charities but the smaller percentage of families in urban areas who actually contribute to religious charities generally gives higher amounts than rural contributors.
In summary, considerable variation has been noted in both participation rates and the absolute level of religious charitable donations by families ranked according to a number of socio-economic and demographic characteristics.
HARRY KITCHEN
Department of Economics, Trent University