A. Introduction
In 1982, it is estimated that families in Canada donated $1.65 billion in gifts and contributions to Canada’s charitable organizations.1 Most of these contributions were provided for the support of religious, cultural, scientific and educational activities. In 1986, it is expected that total charitable donations by families will amount to roughly $2.2 billion. These figures do not include contributions made by corporations and foundations.
Whether or not these totals are high may be debatable, however, it should be noted that almost all of the contributions support services with “public good” characteristics,2 i.e., they benefit many more people than the few who use them directly. Thus, they complement government programs and tend to lighten the taxation load which would be required if such services were provided through the public sector.
The statistical significance of the effect of a number of factors which determine a family’s charitable giving3 and the relative merits of alternative tax schemes designed to influence the volume of charitable contributions4 have been discussed elsewhere. This paper will outline various characteristics associated with the size and distribution of charitable contributions by family across Canada in 1982. It should be emphasized that the paper will deal only with charitable donations by families and that this choice was based on the belief that the decision about the level of charitable donations is usually a joint decision of both spouses (i.e., the family) and that family rather than individual characteristics are more important in determining the size of the annual donations.
The data employed in this paper were extracted from the Statistics Canada microdata tape 1982 Survey of Family Expenditures which contains data collected from their Survey of Family Expenditures in 1982. All computations based on this data were done by the author of this paper. The data presented are weighted (according to Statistics Canada weights) so as to generate results which are representative of all families in Canada, in total, and by region.
Furthermore, the material presented in this paper is primarily descriptive and, only occasionally, analytical. As such, a description of the relationship between a number of family characteristics and charitable giving is presented and variations in the relationships are provided and compared across income groups and regions. (In a later issue, religious charitable donations will be studied separately from total contributions.) Topics covered include: the absolute number of contributors, the level of charitable giving, charitable donations as aper cent of family income arranged by i) age of the head of household,* ii) education of the head of household, iii) sex of the head of household, iv) mother tongue of the head of household, v) occupation of the head of household, vi) living quarters, vii) area of the residence, and viii) total family expenditures.
* Statistics Canada defines “head of household” as “the person mainly responsible for maintenance of the household”.
B. Total Charitable Contributions
i) Number of Contributors by Size of Contribution and Regional Location
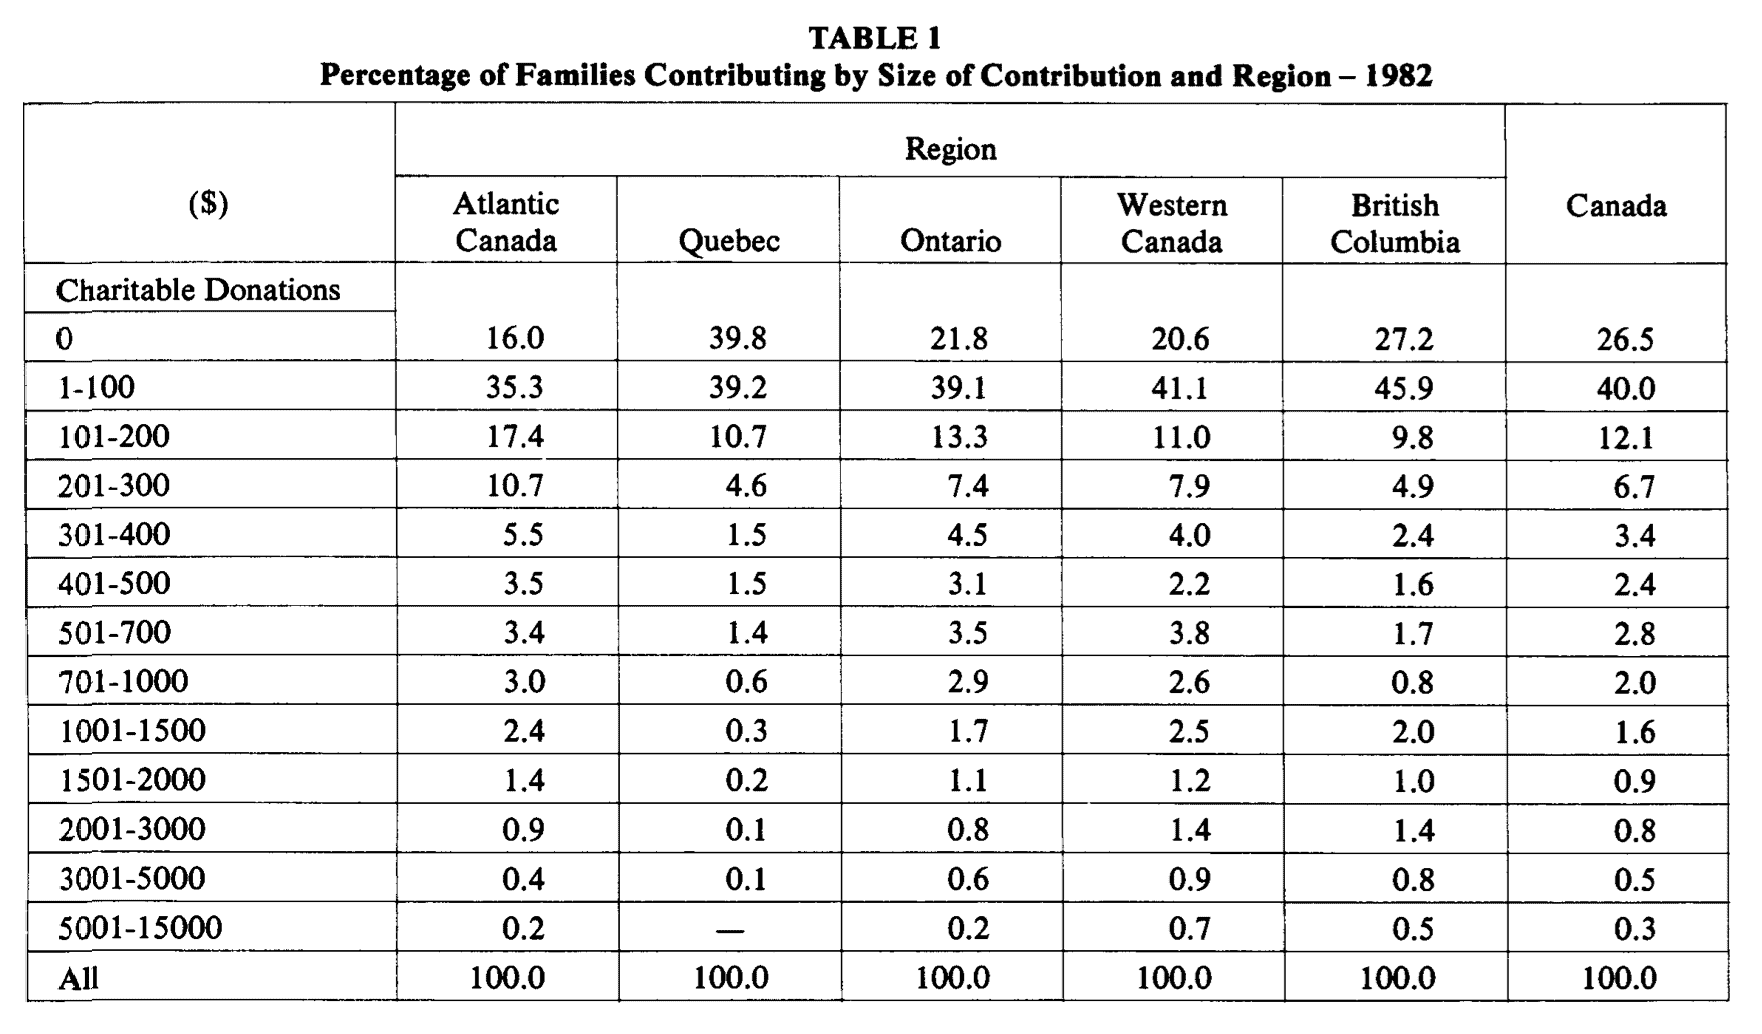
The “Canada” column in Table 1 (last column), shows that, overall, one quarter of all families in Canada made no charitable contributions in 1982 and a further 40 per cent gave between one dollar and $100. The remaining 35 per cent contributed more than $100.
The same variation is not evident in a regional breakdown. For example, in the province of Quebec, almost 40 per cent offamilies made no contributions while in other regions the non-contributors ranged from a high of 27 per cent (British Columbia) to a low of 16 per cent (Atlantic Canada). Atlantic Canada had the lowest percentage of contributors (35 per cent) in the group contributing one dollar to $100 while British Columbia had the highest (almost 46 per cent). Thus, to sum up, less than 52 per cent of all contributors in Atlantic Canada are found in the group making the smallest contributions while 79 per cent of all families contributing in Quebec gave $100 or less. The corresponding percentages for Ontario, the Prairie Provinces and British Columbia were, respectively, 61 per cent, 62 per cent and 73 per cent.
In the case of contributions in excess of $100, the per cent of families contributing varied inversely with the size of the contribution made (Table 1).
Although the proportion ·of families giving to charitable causes varies quite noticeably across regions, there is some question as to whether this variation is statistically significant or whether it can be explained by chance. To determine if there was a statistical significance between the number of families contributing by income class and the location of these families by region, a chi-square ( x 2 ) test was conducted on the data.s The results suggest that in four of the five regions in this study (Ontario is the exception), the number of contributors by income class is dependent upon the regional location of the contributors. The calculated chi-square statistic for Atlantic Canada is 198.36, for Quebec, 365.13, for Ontario, 30.63, for the Prairies, 60.38, and for British Columbia, 71.49.6 The conclusion is that in four of the regions there is a dependency between regional location and the percentage of families contributing.
ii) Size of Contribution by Income Level and Region
Table 2 records the average level of all charitable donations7 by gross family income along with the number of contributors in each income class for both Canada as a whole and the five regions. Overall, the average level of family contributions in Canada in 1982 was marginally more than $200. This figure, however, displayed considerable variation across the regions, and ranged from a low of$83 per family in Quebec (41.5 per cent of the Canadian average) to a high of $288 in the Prairie Provinces (144 per cent of the Canadian average). In the remaining regions, the average family contribution exceeded the Canadian average in every case. Not surprisingly, and with few exceptions, the average level of contributions in each region varied directly with income, i.e., as the size of family incomes increased, the size of contributions tended to rise.
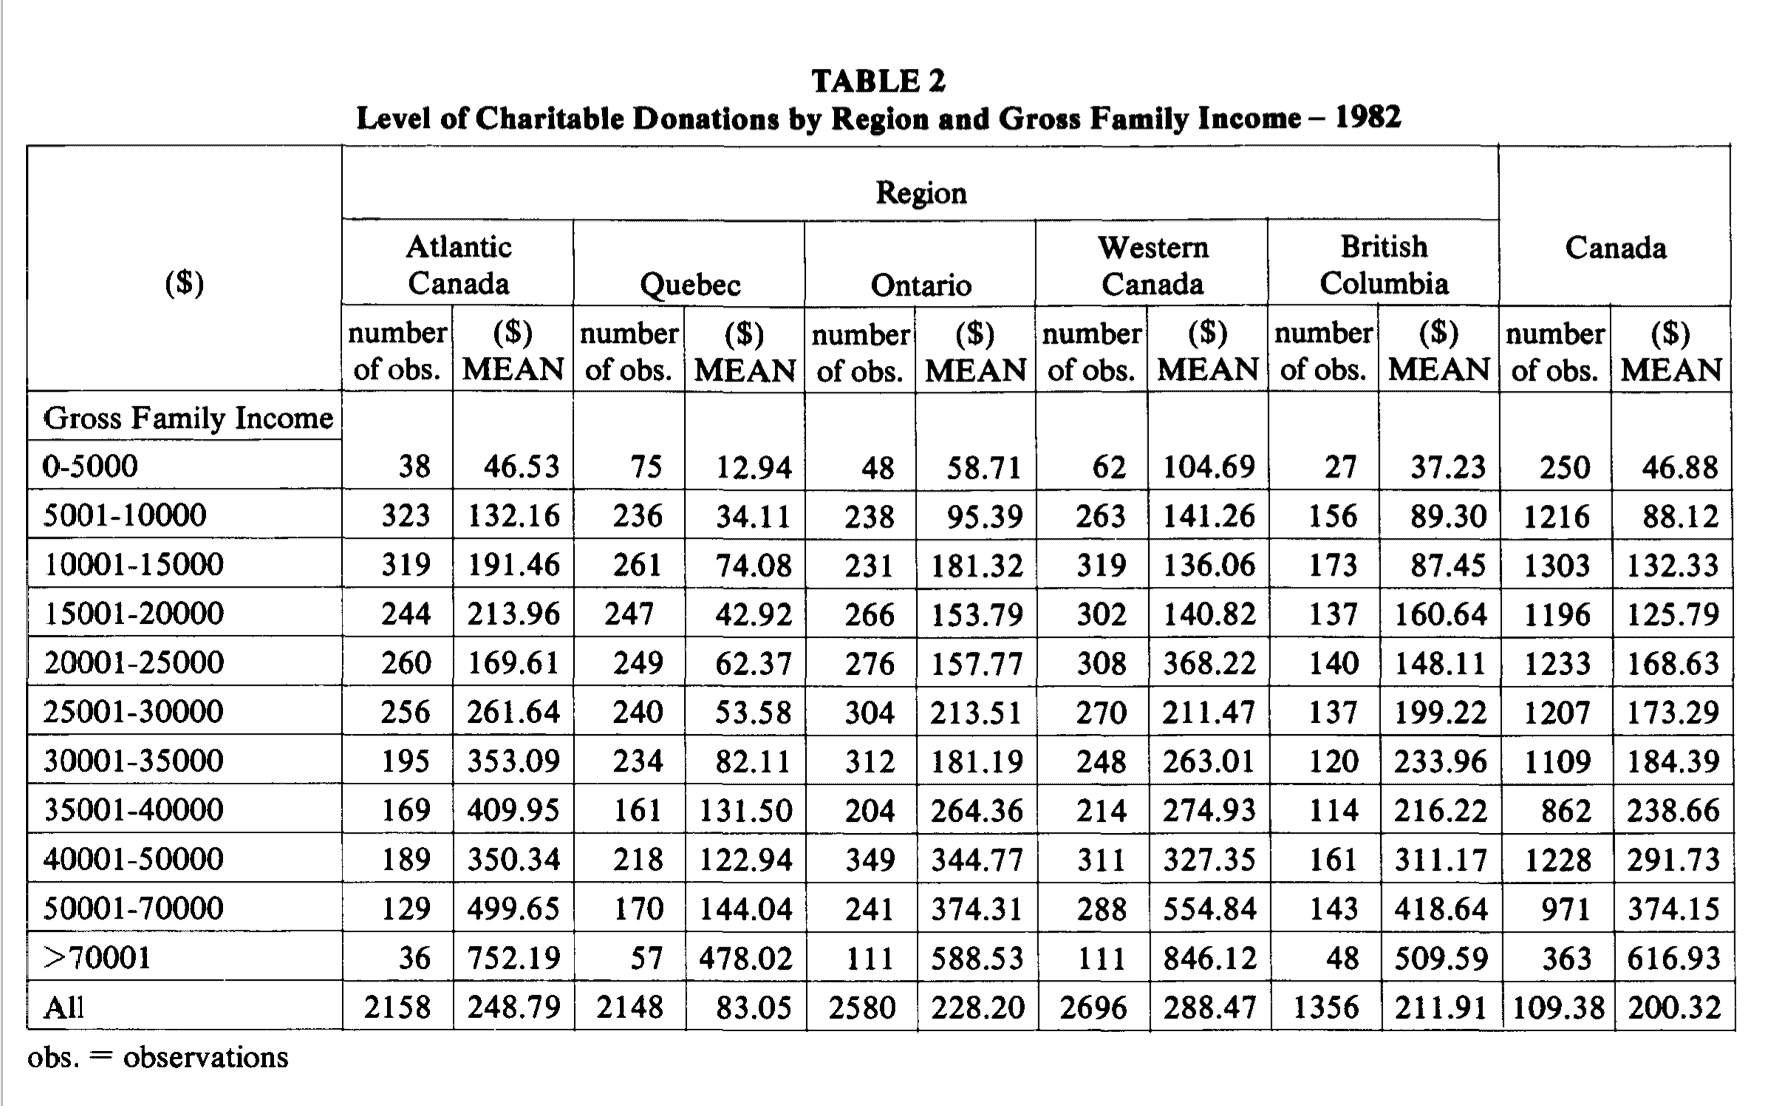
Once again, it may be of some interest to test for the statistical significance of these differences. Can the reported variation in the level of charitable giving by income level and/or by region be attributed to chance and is this variation significantly different in a statistical sense?
Application of the analysis of variance test (F statistic) allows one to test for independency across income groups and/or regions; for example, the average level of charitable donations reported by income level differs according to family income. Can these differences be attributed to chance or can they be attributed to differences in income levels? If the calculated F statistic exceeds a critical limit (obtained from published statistical tables), it can be argued that this variation cannot be attributed to chance but those differences are, instead, dependent on family income. In this instance, the calculated F statistic of 43.95 far exceeds the critical value of 2.20 (at the one per cent level of significance) which suggests that the average level of charitable donations is dependent on income. While this result is not surprising (in fact, it is exactly what one would expect), the significance of the variation in the average level of contributions by region is somewhat surprising. Here, the calculated F statistic is 43.54 (critical limit is 3.34 at the one per cent level of significance). This implies that the average family contribution across regions cannot be attributed to chance, but is rather, dependent on regional factors.
The final F statistic is one which compares the variation in charitable giving by both income level and region simultaneously, i.e., a significant value for this F statistic suggests that regional variations by income levels exist and within regions the pattern of variation across income levels is also different. In this instance, the calculated F statistic is 1.77 and is significant at the eight per cent level; that is, eight times out of 100, this variation can be attributed to chance or, alternatively, 92 times out of 100 the differences are dependent on both income and region.
In summary, it can be stated with a high degree of certainty that variations in charitable donations by both region and income levels are significantly different in a statistical sense.
iii) Religious Charitable Donations
For the purposes of this study religious contributions have been separated from total contributions because there is a widespread belief that religious giving displays differing patterns across income groups and across regions, as well as across age, sex, education, occupation, and residential location.
These beliefs and other aspects of religious giving will be examined in the study’s second paper which will appear in a future issue of The Philanthropist.
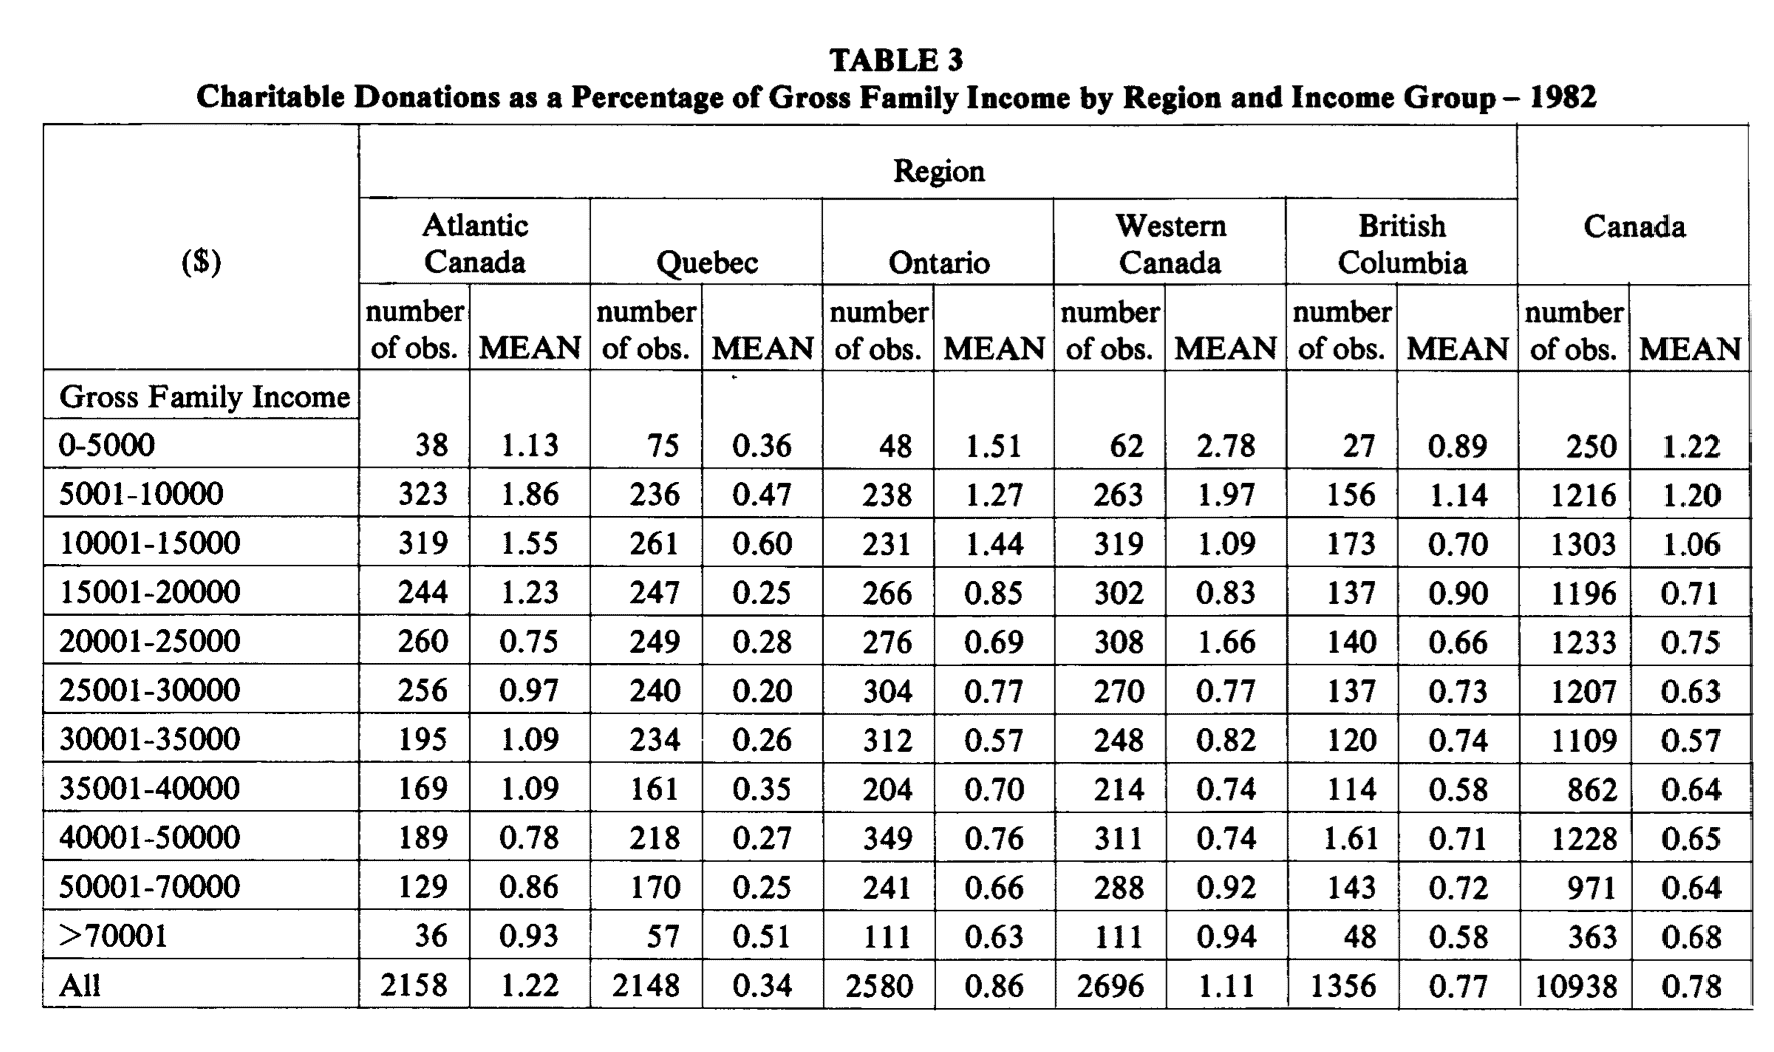
iv) Charitable Donations as a Percentage of Family Income by Income Level and Region
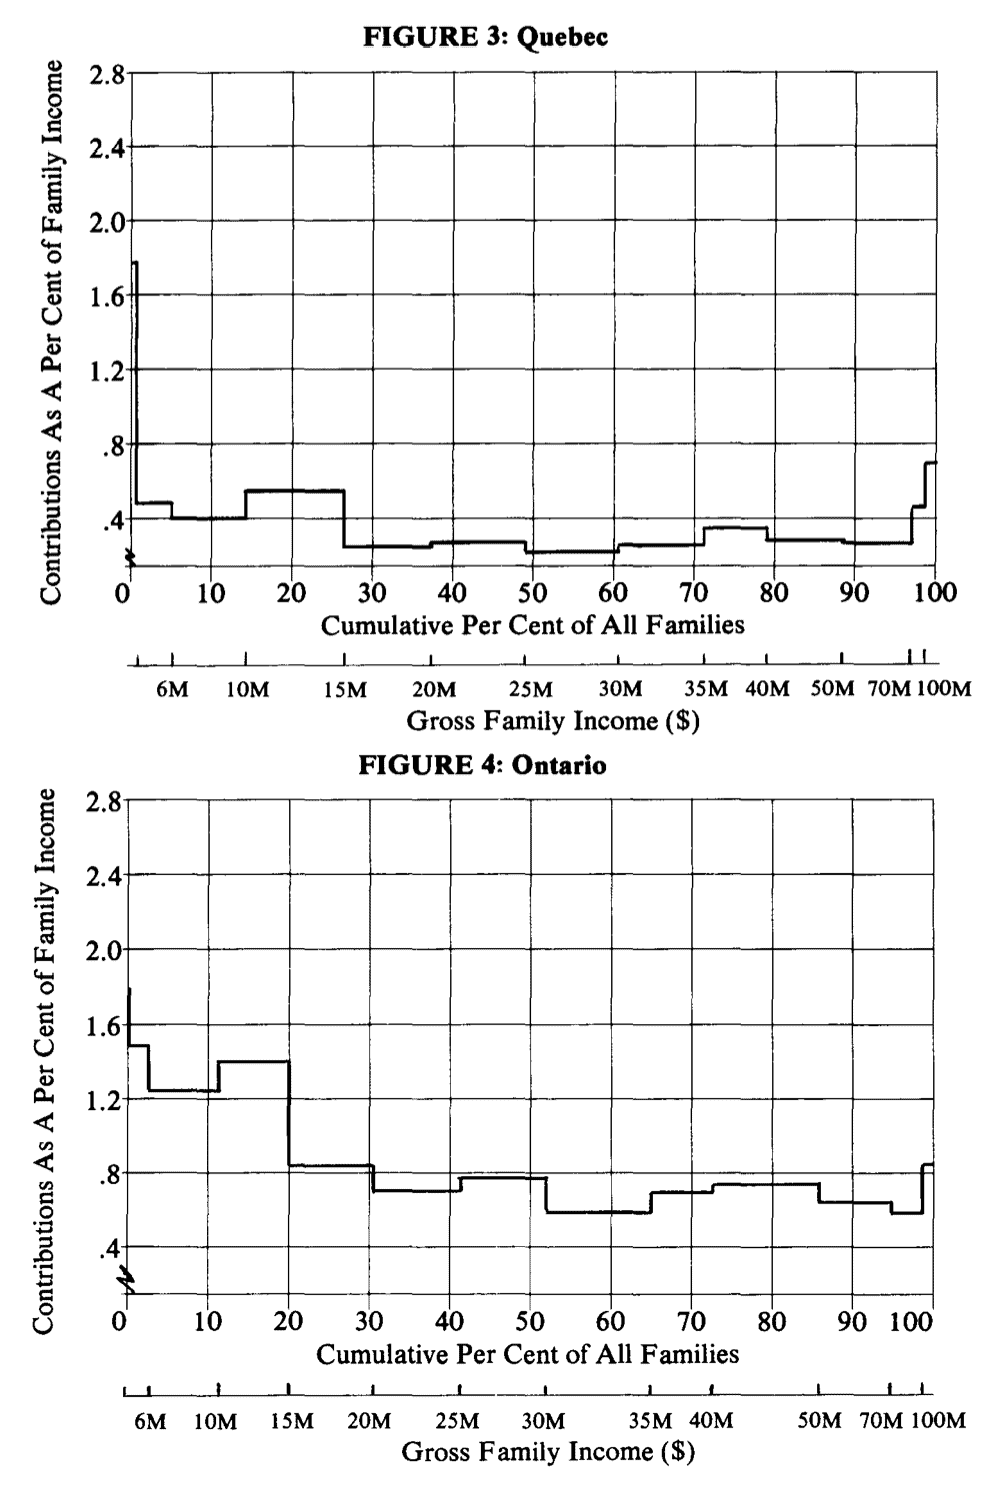
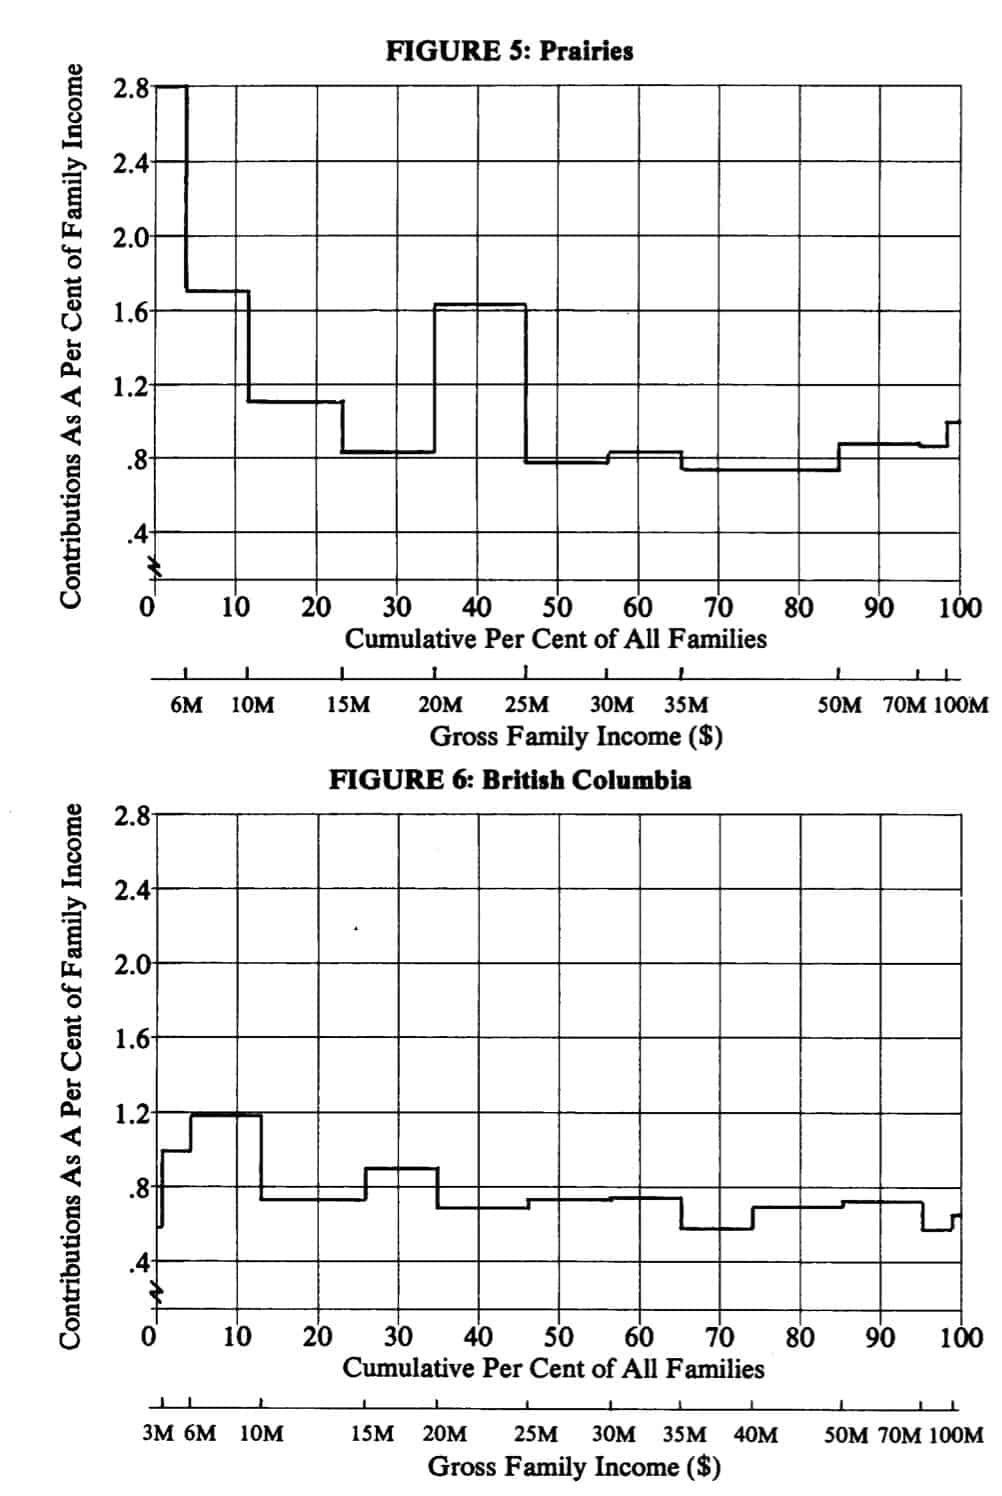
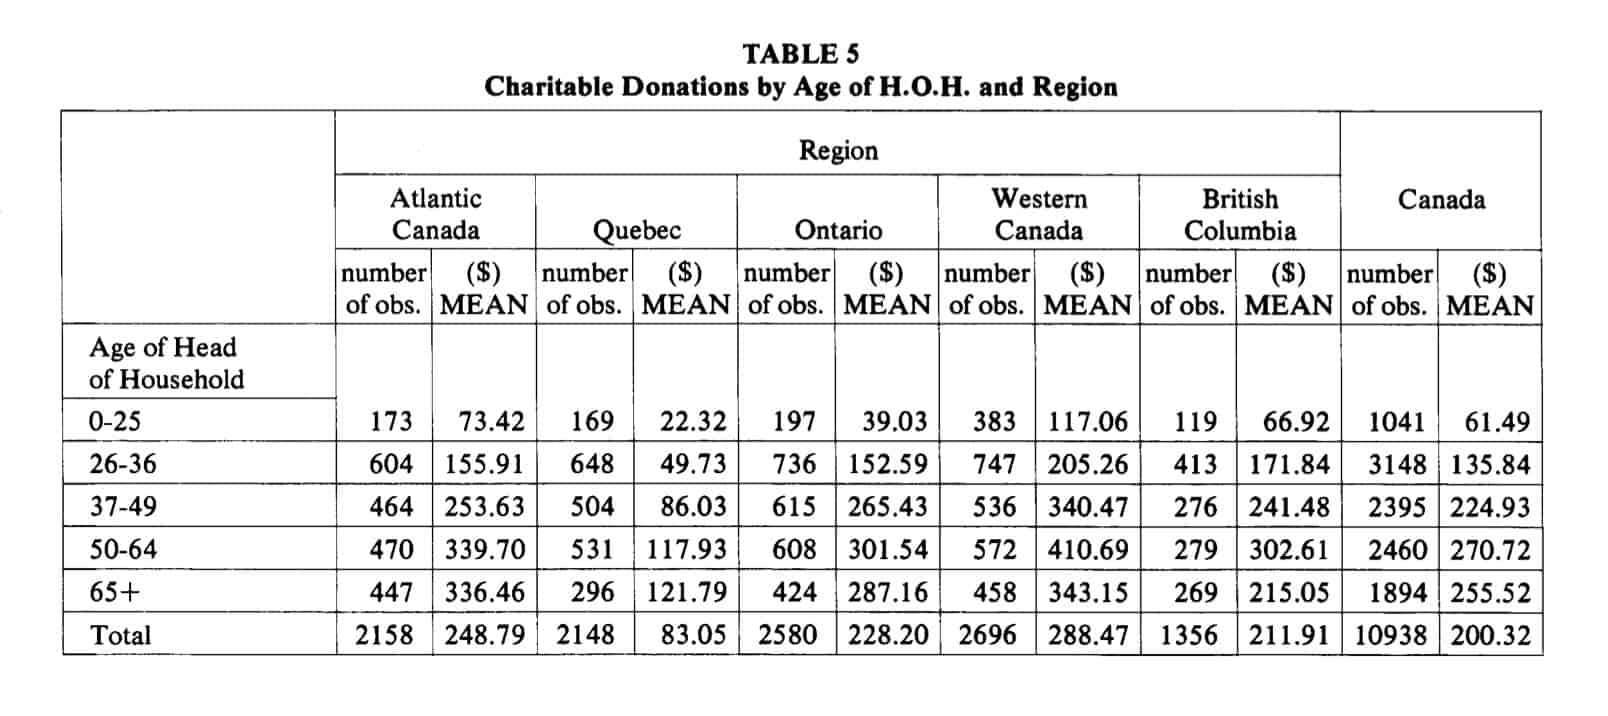
While information about the absolute size of charitable donations by family is both interesting and useful, it does not provide any indication of the way in which these donations relate to family income. To overcome this weakness, Table 3 lists all charitable donations as a percentage of gross family income by region and income group.8 These figures reflect the average propensity to donate of different income levels. Figures 1 to 6 are included on the premise that “a picture is worth a thousand words”. They are derived directly from the information in Table 3, first for Canada (Figure 1) and second, for each of the regions separately (Figures 2 to 6). In each figure, the horizontal axis is marked by income percentiles so as to give equal weight to each family in the population. Each income class is thus weighted by the percentage of families falling in it. Below the percentile distribution are the corresponding absolute levels of income. For all of Canada (Figure 1), the rate at which contributions are made is relatively high at low income levels, then declines rather consistently as income increases until the range surrounding the median income level is reached. Here the rate is fairly constant. Only in the $100,000 and over income range, a rather minute percentage of the population, does the rate at which contributions are made rise noticeably.
That this tendency towards a U-shaped relationship between giving and family income in Canada as a whole is not as evident in each of the separate regions is shown in Figures 2 to 6. Perhaps the best approximation of a U-shape in the regions is evident in Quebec (Figure 3) and Ontario (Figure 4) although in these regions as well there are minor deviations from a smooth relationship between giving and income. The other feature worth noting in a comparison of these two provinces is that Quebec families are much less likely to give than their Ontario counterparts. In fact, across almost all income groups and in comparison with all other regions, Quebec families tend to give a smaller percentage of their incomes to charitable organizations.
Families in Atlantic Canada (Figure 2) and the Prairie Provinces (Manitoba, Saskatchewan and Alberta) (Figure 5) tend to contribute a higher percentage of their family incomes to charitable organizations when compared with similar families elsewhere in Canada. British Columbia families, on the other hand, have a tendency to give a higher percentage than those in Quebec, but less than those in the remaining regions.

v) Charitable Donations as a Percentage of Gross Family Income By Size of
Charitable Donation and Region
Whereas Table 3 and Figures 1 to 6 show the relationship between giving and gross family income, Table 4 reports charitable donations as a percentage of family income by size of contribution and by region of residence. For the most part in Canada as a whole (last column of Table 4) and in the regions separately, there is a relatively smooth and increasing tendency for charitable donations to absorb a higher percentage of income as the size of charitable donations increases.
vi) Distribution of Charitable Donations By Different Socio-Economic and Demographic Indicators
Up to this point, the descriptive statistics provided have concentrated on charitable donations and their relationship to family income. In this section, the intention is to present information on the relationship between charitable donations by family and a number of socio-economic or demographic indicators which may have some bearing on charitable giving. The socio-economic indicators include age of the head of household, sex of the head of household, mother tongue of the head of household, occupation of the head of household, living quarters of the family, size of the municipality or community in which the family residence is located, and the level of family expenditures.
a) Age of Head of Household
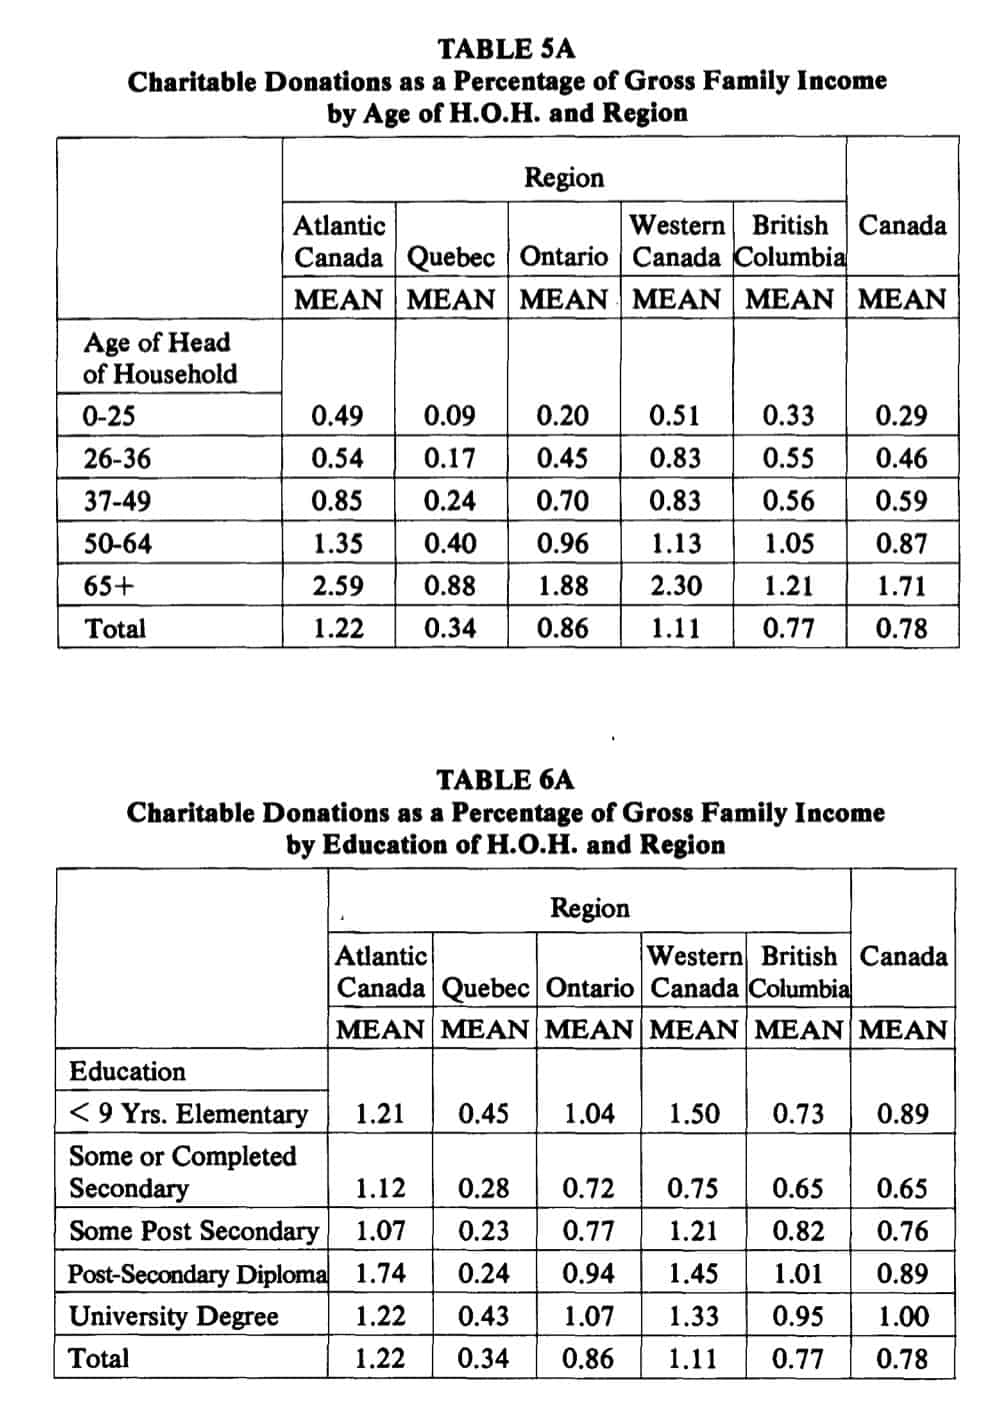
Table 5 shows the average level of charitable contributions by family ranked by the age of the head of the household. Overall, the 50-64 age group contributed the highest amount with the over 65 group falling slightly behind and the 37-49 group still lower. The results in each region display the same general pattern, although their absolute size varies. They also support the hypothesis that charitable donations are more likely to be made by those who are no longer incurring the expense of raising a family or acquiring consumer durables.
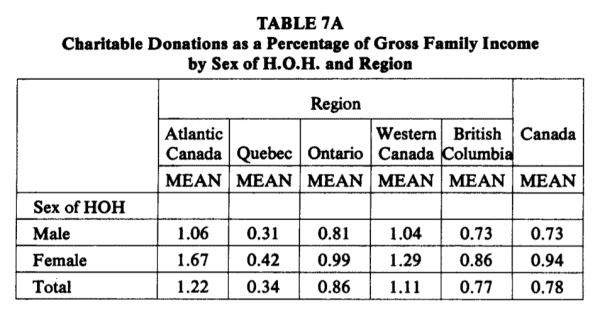
When charitable donations by family are taken as a per cent of gross family income and recorded by the age of the head of household and by region, the results (Table SA) indicate that a continuously higher percentage of income is absorbed by charitable giving as the head of household becomes older. This pattern is similar for families in all regions, a result which might be expected.
b) Education of Head of Household
With only one exception (Atlantic Canada), families where the head of household holds a university degree give more in charitable donations that those at other educational levels (Table 6). Holders of a post-secondary diploma rank second (except in Atlantic Canada where this group gives the most), while families where the head of household has some post-secondary education are third. In families where the head of household has only elementary education or some, or all, of secondary education, the average level of donations by family tends to vary depending on the regional location but is lower, on average, than in the other three categories.

It would be expected that in most cases the holding of a university degree or degrees would be associated with higher income levels so it is not surprising to find this group contributing more to charitable causes.
When charitable donations by level of education are calculated as a percentage of gross family income, with a few exceptions, a U-shaped pattern emerges from a plotting of the relationship between giving and the level of education (Table
6A). This implies that families where the head of household had eight years or less of elementary education and those families where the head of household has a university degree tend to contribute larger percentages of their family incomes to charity than families in other educational groups. The U-shaped pattern is most evident in Quebec, the Prairie Provinces and British Columbia and also emerges for Canada as a whole (Table 6A). The relationship between the emergence of this pattern and the level of religious contributions will be examined in the study’s second paper.
c) Sex of Head of Household
In Table 7 family charitable donations are related to the sex of the head of household. In every region and thus, obviously, in Canada as a whole, the average level of charitable donations is higher in families headed by males. This is undoubtedly related to the fact that many female-headed families are singleincome families as well as to the fact that female incomes are normally much lower than those for males with the same education. Table 7A tends to support the suggestion that family incomes are higher where the head of household is male but also tends to indicate that in every region, and Canada as a whole, charitable donations absorb a larger percentage of family income when the family is female-headed although the average contribution in dollars is lower. Further support for the view that male heads of household earn more than female heads ofhousehold and, therefore, have a greater capacity to give, comes from a comparison of the before-tax income levels of each of these groups. These data show that males in Canada earned, on average, 69 per cent more than females. Across the regions, this differential in earnings ranged from a low of 64 per cent in Atlantic Canada to a high of 74 per cent in British Columbia.
The data also support the view that more female than male heads of household tend to be the sole income earners for their families. For example, where females are listed as heads of household, they account for more than 82 per cent of all family income while the income of male heads of household accounts for less then 78 per cent of their family incomes. More specifically, this differential of four percentage points is approximately the same in each region.
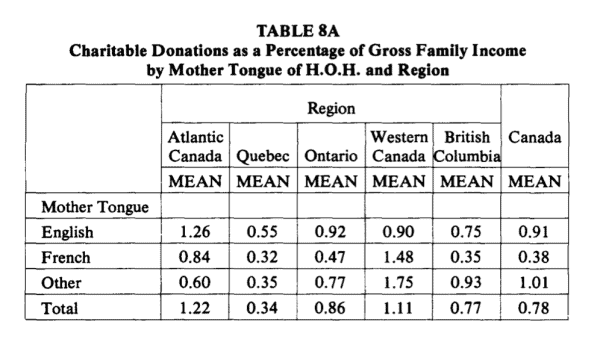
d) Mother Tongue of Head of Household
Charitable contributions by families vary, depending on the mother tongue of the head of household (Table 8). For Canada as a whole, where the head of the household’s mother tongue is French, the average giving is considerably lower than in families where the head of household indicates English as a mother tongue and is also lower than all others together. (In Canada as a whole, families whose head of household has a mother tongue other than English or French have an average contribution that is slightly higher than those where the mother tongue is English.)


This pattern of variation is not, however, evident in each of the regions. For example, in the Prairie Provinces, the average contribution of families with French as the mother tongue of the head of household is more than 20 per cent higher than the average of families with English as the mother tongue, but approximately 20 per cent less than that of families with other mother tongues. Elsewhere, however, families where the mother tongue is French lag behind both those where the mother tongue is English and “all others”.
When the mother tongue of the head of household falls into the category “all others”, families in the Prairie Provinces and British Columbia contribute, on average, more than either of the other two categories, while families where English is the mother tongue contribute the highest absolute amount in Ontario, Quebec and Atlantic Canada (Table 8).
In Table SA when family contributions are considered as a percentage of family income, much the same pattern is reflected as is evident in Table 8. In the Prairie Provinces and British Columbia, charitable donations constitute a higher percentage offamily income in the category of”all others”, whereas, in the rest of the country the percentage is higher in families where the head of household’s mother tongue is English.
e) Occupation of Head of Household
In Canada as a whole, the teaching profession, on average, contributed the largest dollar amount to charities (last column of Table 9). The categories managerial and administration, professional and technical, and farming, fishing and forestry, followed at levels which were between 15 and 20 per cent lower.
On a regional basis, however, considerable differences emerge. In British Columbia, for example, families headed by teachers, on average, gave considerably less than either the managerial and administrative or professional and technical groups. This pattern was reversed in the Prairie Provinces where teachers gave more than the other two groups but slightly less than farmers, fishermen and forestry workers. In Ontario, families headed by teachers contributed noticeably more than any other occupational group while teacherheaded families in Atlantic Canada and Quebec trailed the managerial and administration group. The importance of the sales occupational group should also be noted. In Quebec, their contributions exceeded those of all other occupations while in the rest of Canada, their contributions tended to hover slightly below or slightly above the average for all other occupations in each region.
Although certain occupational groups tend to give more, this may be less related to occupation than a direct reflection of the fact that these groups earn higher family incomes. Table 9A provides us with some evidence to test this hypothesis. In Canada as a whole (last column), heads of households who were not working or retired contributed the largest percentage of their family incomes to charity. They were followed closely by the group which includes farmers, fisherman and forestry workers and these two occupational groupings were . followed, in turn, by teachers, professional and technical people and the managerial and administrative category. Excluding the retired or not working, it will be seen that, not only are family contributions high for the other four groups listed above, but families in these occupational categories tended to give a larger percentage of their incomes to charitable organizations.
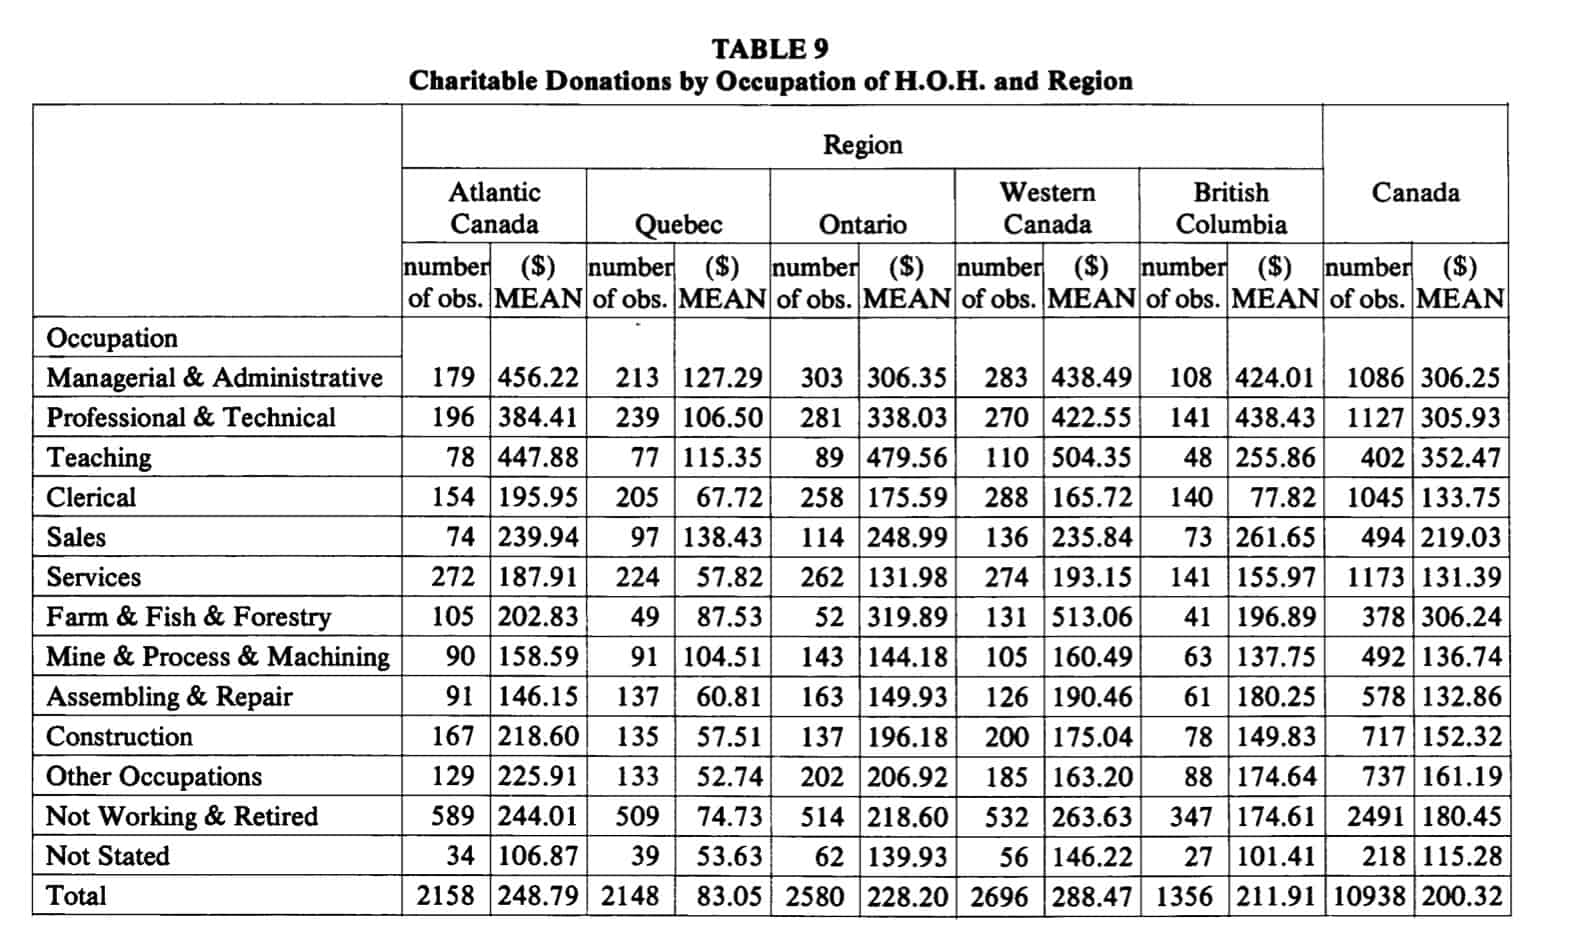
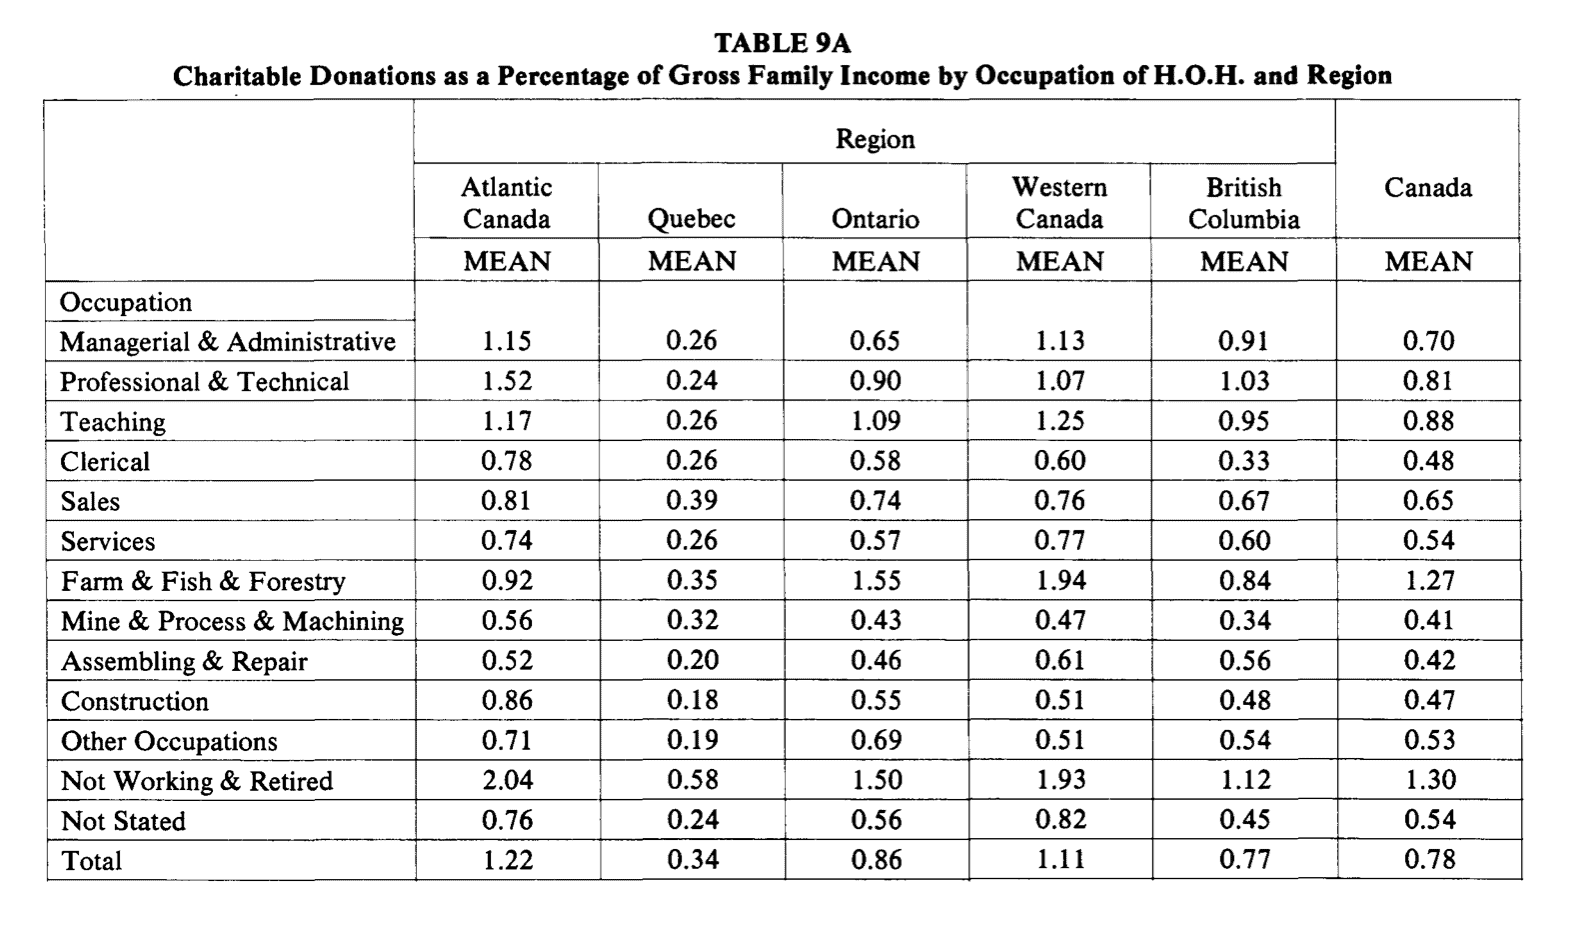
Significant regional variation, however, does not exist in the proportion of family income devoted to charitable contributions (see Table 9). In Atlantic Canada, the same group who were retired or not working, gave more than two per cent of their family incomes to charity while the corresponding group in the Prairie Provinces gave slightly less than two per cent. Elsewhere, this percentage ranged from 1.5 per cent in Ontario to slightly less than six-tenths of one per cent in Quebec. Excluding families in Quebec, families headed by teachers gave slightly more than one per cent of their family incomes in the remaining four regions. Although the range tended to be slightly wider, similar observations can be made about the three categories: 1) managerial and administration, 2) professional and technical and farmers, and 3) fisherman and forestry workers. For all remaining occupational classifications, the level of income devoted to charitable donations is noticeably below one per cent of family income.
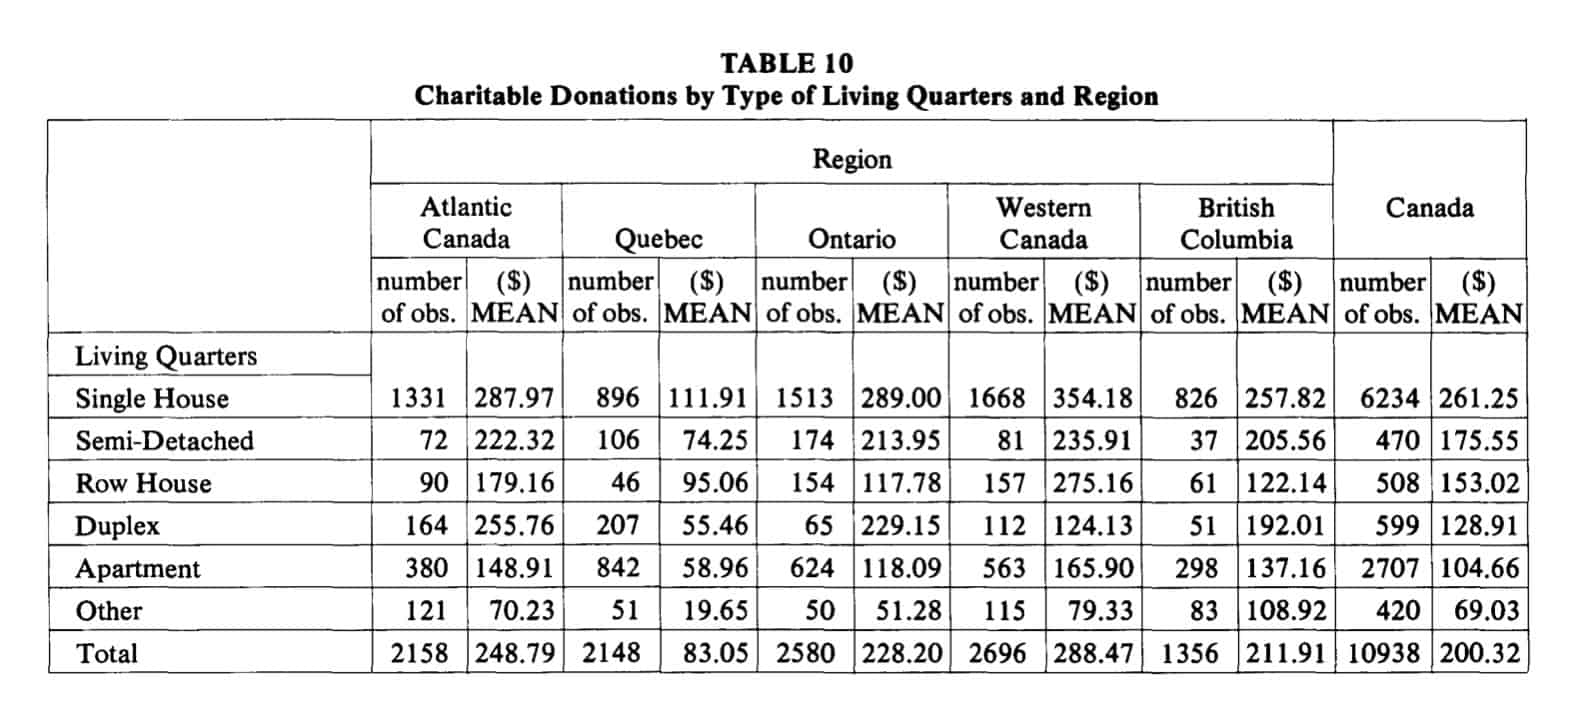
f) Living Quarters
Although there is no a priori view of the direction and magnitude of the relationship between the type of living quarters and the level of family charitable donations, Table 10 records this information. Families living in single detached homes contribute significantly more than families living in other types of accommodation. It is possible to speculate that this may be because those living in single detached homes have already acquired the general type or style of dwelling which they desire, whereas families in other types of accommodation are still aspiring to, and perhaps saving for, single detached dwellings.
When these contributions are viewed as a per cent offamily income, once again families in single detached homes, on average, give a larger percentage of their incomes to charitable causes (Table 10A) than do families in other accommodation. On a regional basis, and regardless of the type of accommodation, families in British Columbia and Quebec gave (on average) less than one per cent of their incomes. With the exception of duplex occupants, families in Ontario displayed the same pattern. Atlantic Canada, on the other hand, is one area in which families appear to donate more than one per cent of their family incomes regardless of the type of dwelling they occupy. (This excludes the “other” category.)
g) Size of Area of Residence
Table 11 presents information on the level of family charitable donations as related to the size of the municipality in which the donors reside and by region.

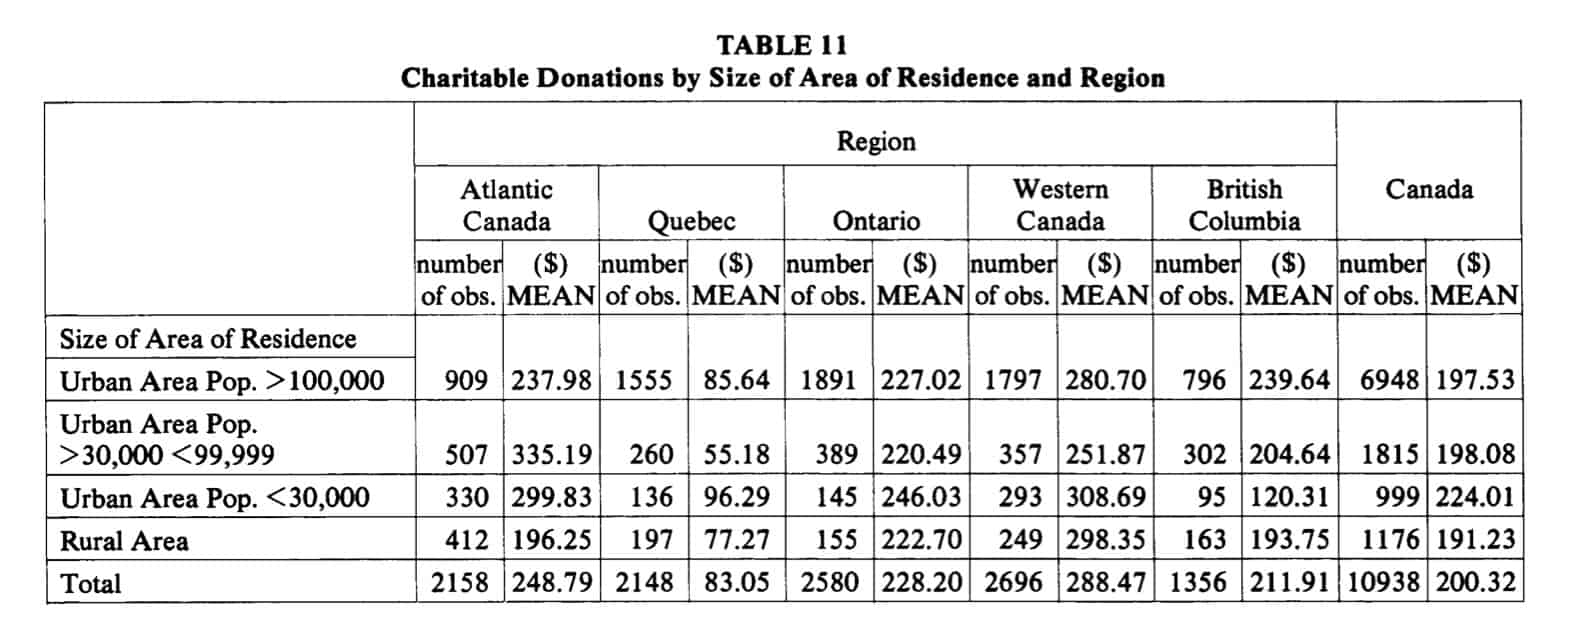
As in the preceding section, there is no particular hypothesis to be tested. In this table, in Canada as a whole, the families in urban areas with more than 30,000 people and those in rural areas, on average, made approximately equal contributions. In Canada as a whole, families in urban areas of less than 30,000 people appeared to be slightly more generous (final column of Table 11). This pattern, however, is not the same in each of the regions. For example, in British Columbia, families in the smallest urban areas (less than 30,000 people) contributed noticeably less than those in other areas, while in Quebec, Ontario and the Prairie Provinces, the opposite is the case.
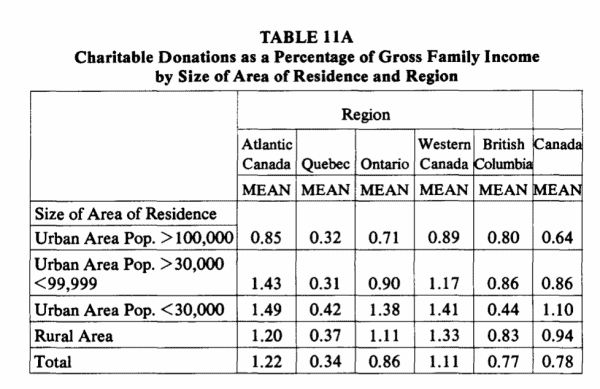
When this contribution is computed as a per cent of family income (Table 11A) the percentages follow the pattern in Table 11.
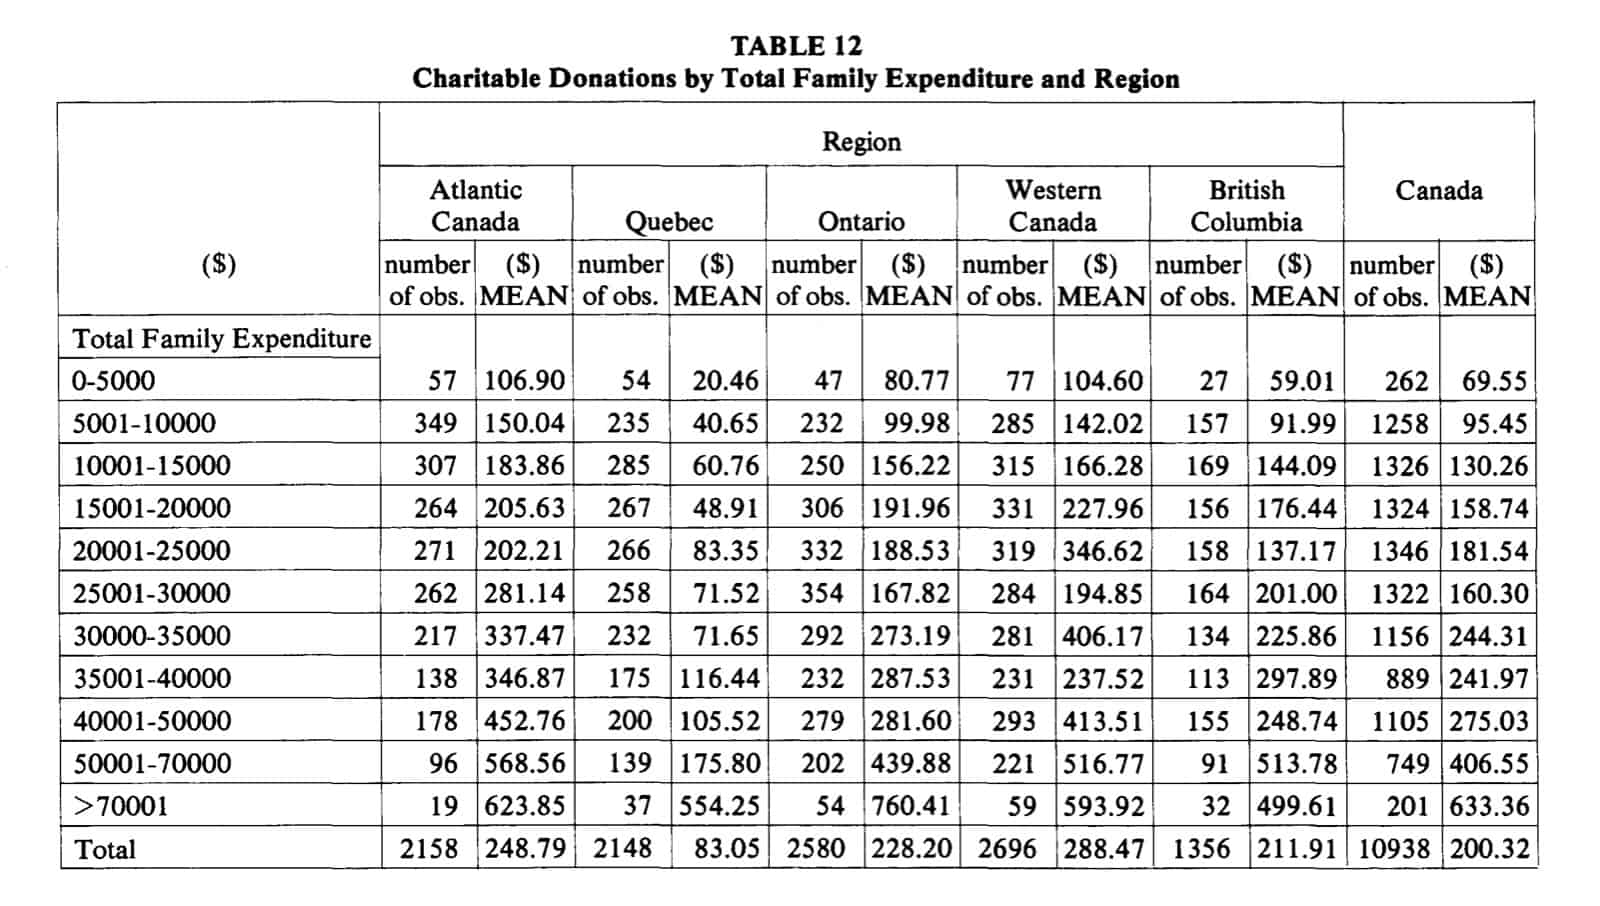
h) Total Family Expenditures
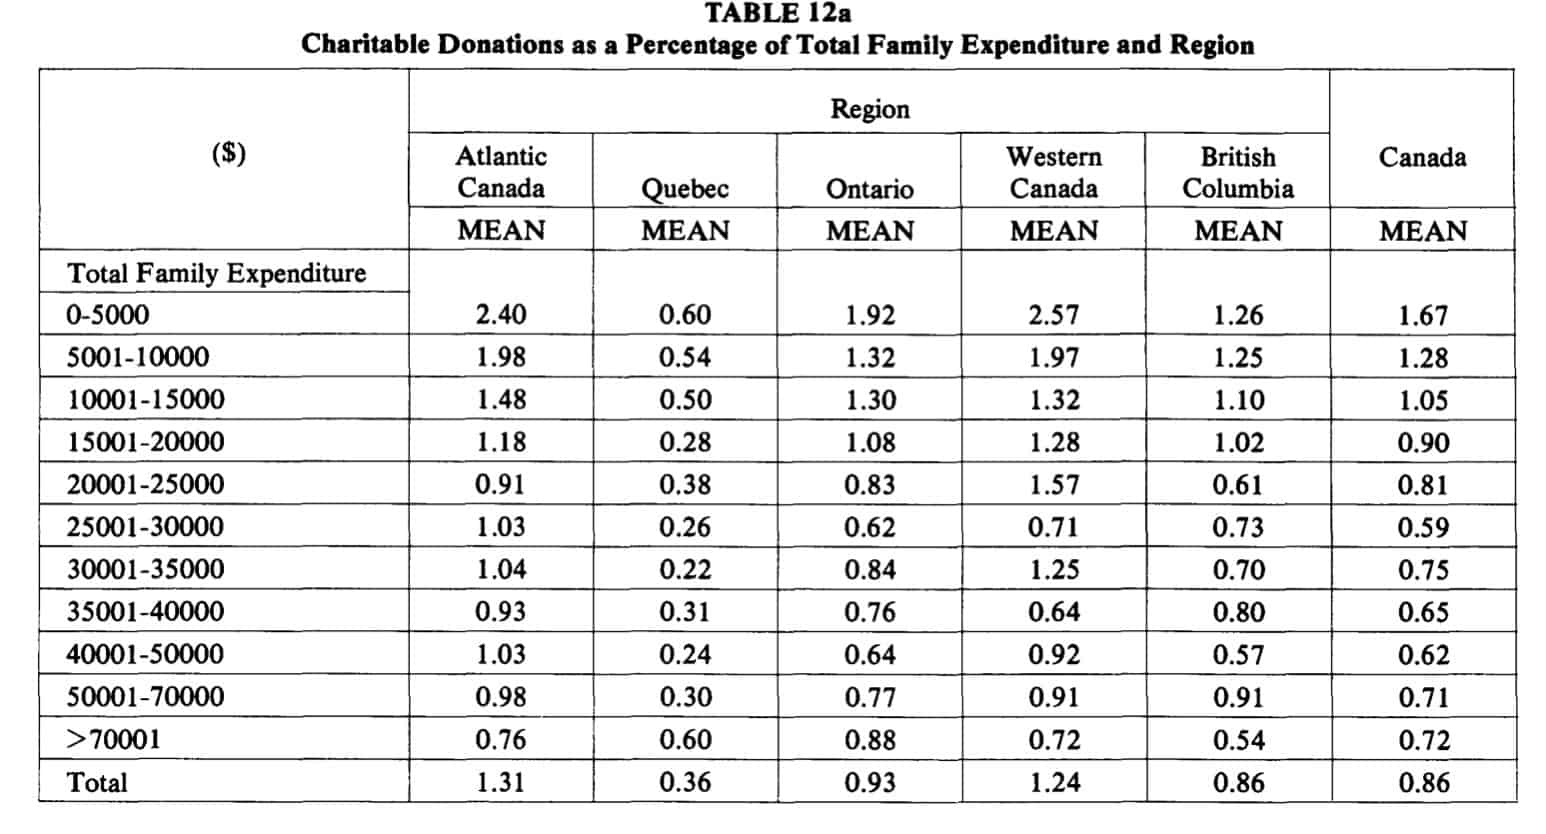
Rather then relating charitable donations to family income, it was felt that interesting and potentially useful results might be obtained by observing charitable donations by total family expenditure groupings. Table 12 records this information. Not surprisingly, in every region, the average level of charitable giving tends to rise as family expenditures increase. When charitable donations are recorded as a percentage of all family expenditures, a U-shaped pattern between charitable giving and level of expenditures emerges for Canada as a whole (last column of Table 12A). A similar U-shape, with some minor deviations in certain family expenditure groupings, exists for each of the separate regions. As was observed in the data indicating the average propensity to give (Figures I to 6), families in Atlantic Canada tend to devote a higher proportion of their family expenditures to charitable causes than families in other regions while families in Quebec spend a smaller proportion.
C. Summary
It is the intention of this paper to present data which illustrate certain relation
ships between charitable donations by families and various socio-economic and demographic characteristics associated with either the head of the household or the family as a whole. The choice of the family, specifically the head of household and his or her spouse, rather than the head ofhousehold alone as the unit for relating charitable giving to specific family or head-of-household characteristics was based on the assumption that decisions about contributions are made jointly rather than individually.
Using the data from the Survey ofFamily Expenditures for 1982, this paper has shown certain patterns both across income groups and across or between regions. The reader should understand, however, that in almost every instance, no attempt has been made to explain why these patterns have arisen or why differences might exist. The paper is intended to be informative rather than interpretive.
Throughout the paper, an attempt has also been made to arrange and present the characteristics associated with charitable giving in various ways. Without, reviewing the details, some statistically significant differences across regions should be noted. First, the percentage of all families contributing, ranked by the size of charitable donation, varies across regions (Table 1). Similarly, the level of contributions for similar income groups differs across regions (Table 2). Furthermore, when these contributions are recorded as a percentage of family income, regional variation is equally evident (Table 3).
Second, if charitable donations are ranked from smallest to largest, in all regions there is a continuously increasing percentage of income devoted to charitable giving as dollar givings increase (Table 4).
Third, when family donations are related to the characteristics of the head of household, a number of observations can be made. Families in which the head of household is over 50 years of age (Table 5) tend to give more than those in which the head of household is younger. The level of education of the family head also seems to bear a direct relationship to charitable contributions (Table 6). Families with male heads of household, on average, tend to contribute more than families with a female head of household (Table 7). Also it would appear that the mother tongue of the head of household can be correlated with the size of charitable donations (Table 8) although there is considerable variation in the importance of the various mother tongues across regions. Families with heads of household in certain occupations are more generous in their givings (Table 9) than others.
Fourth, some demographic characteristics of the family have been identified (without explanation) with the level of contributions. For example, the style of living quarters (Table 10) and the size of the urban or rural area (Table 11) produce variations in charitable donations.
Fifth, charitable contributions as a percentage of family expenditures exhibit a
pattern similar to that which appears when contributions are considered as a percentage of family income (Table 12).
In summary, variations in charitable donations can be identified and associated with differences in a number of socio-economic and demographic factors. These results should be of considerable interest to government policymakers who see the advantages of the private sector’s contribution to a number of services which might otherwise be the responsibility of government. This substitution of private for public support might be encouraged by government tax or expenditure policies if policymakers are aware of the various characteristics, identified in this paper, which are associated with private sector donor families. In addition, some of the material in this paper should be of assistance to charitable organizations themselves, especially if they are trying to identify potential donors. Knowledge of certain socio-economic and demographic factors related to donor families may permit them to direct their fund-raising efforts to those who are most likely to contribute.
ACKNOWLEDGEMENT
The author is indebted to Jeff Lanctot for invaluable research assistance in completing this paper. Additional thanks go to Professors J.A. Johnson and R.W. Thompson of McMaster University, Professors R. Bird and M. Bucovetsky of the University of Toronto, Dr. John Posnett of York University in England, David Perry of the Canadian Tax Foundation, and Harry Champion of Statistics Canada for helpful comments on an earlier draft. Any errors or omissions, however, are the sole responsibility of the author.
FOOTNOTES
1. From the 1982 Survey ofFamily Expenditures tape (Statistics Canada), the average contribution was approximately $200. This figure was multiplied by the number of families in Canada to generate total contributions in 1982. From Taxation Statistics, charitable contributions for all individuals reporting them (this includes only the individuals who claimed charitable donations in lieu of the standard deduction) amounted to $1.4 billion. Hence, one can conclude that approximately $250 million was contributed by individuals who did not claim itemized deductions.
2. For a discussion of “public goods”, see Boadway and Wildasin, Public Sector Economics, Second Edition 1984, pp. 57-60.
3. See G. Glenday, A. Gupta and H. Pawlak, “Tax Incentives for Personal Charitable Donations”, Paper presented at the annual meeting of the Canadian Economics Association at the Universite de Montreal, May 29-31, 1985; J.A. Johnson, “The Determinants of Charitable Giving with Special Emphasis on the Income Deduction Under the Income Tax-A Survey of the Empirical Literature”, Working Paper No. 82-29 McMaster University, Hamilton 1982 and “Government Aid to Charities: An Economic Analysis of Four Proposals”, Working Paper No. 84-13, McMaster University, Hamilton 1984 for a discussion of studies attempting this. The author of this paper is currently engaged in a similar study.
4. See Johnson (1984).
5. A chi-square ( x2 ) test reveals the degree of dependence or independence between two variables. In this instance, it reveals the degree of dependence or independence between family contributors and regional location. If the number of families making charitable donations by income group is independent of regional location, the chisquare statistic will be low. If, on the other hand, the number of families making charitable donations by income group is dependent on regional location, the chisquare statistic will be high. Statistical dependence between the two variables exists when the chi-square statistic exceeds a critical value.
6. For 22 degrees of freedom the critical values according to different levels of significance, are as follows:
x2 .05 = 33.92 x2 .025 = 36.78 x2 .01 = 40.29 x2 .005 = 42.80
Since the calculated chi-square values in this paper exceed the critical values in all regions except Ontario, it can be concluded that regional location and the number of families contributing by income group are often dependent on each other. In fact, the statistical significance of these results exceeds the .005 level.
7. The aggregate figures presented in some of the tables in this paper differ marginally from those published in Table 33 of Family Expenditure in Canada 1982 (Catalogue 62-555, Statistics Canada, Ottawa) because this latter publication includes a slightly larger sample size than is included in the data tape.
8. If one were to take religious contributions as a percentage of gross family income, one would obtain percentages which display the same pattern as those in Table 4 (for both Canada and the regions separately) although at lower values than those recorded in Table 3. Hence, there is very little to be gained in an informative sense from producing this information. In future papers additional information on a number of socioeconomic or demographic factors and their relationship to religious contributions will be presented when it is felt that insights can be gained from the availability of this information.
HARRY KITCHEN
Professor, Department of Economics, Trent University