Introduction
Patterns of funding social services have altered drastically during this century. In the early decades, government provided a rudimentary level of care for the indigent elderly, for orphaned children and for the destitute. The provision of other services was deemed to be the responsibility of the voluntary sector. “Social services” included both social assistance and personal social services. Voluntary organizations and government provided both without a clear distinction between the categories.
In modem times government is considered to be solely responsible for an adequate income level for all citizens. These income maintenance payments are called social assistance. The work of charitable organizations is now largely confined to the provision of personal social services. Ontario citizens have come to expect that government should also be responsible for more of these personal social services. Society, in Ontario, has begun demanding government assistance for more than the indigent elderly and for orphans. Family counselling, day care, homemaking services and help for the handicapped have been requested from government sources.
The government has responded to these pressures by adding some new services. A comparison may be made of programs subsidized in Metropolitan Toronto in fiscal years 1971 and 1976. In 1971 subsidies were provided for five general categories of personal social services. These were: homes and centres for the elderly, homemaking and nursing services, day nurseries, child welfare and children’s institutions, and vocational rehabilitation. In 1976 there was an expanded range of government services: services for the retarded, for rehabilitation, for credit counselling, for work-activity projects, and for new types of services and institutions for children and youth.1
By 1982, the range of programs receiving government subsidization had increased again. Residential facilities for the retarded, the mentally and physically disabled and those discharged from correctional institutions had been added. There were also home support services for the elderly and the disabled and increased family crisis-intervention services.2
In 1971 the cost of subsidized social services (social assistance and personal social services) in Metropolitan Toronto was $104 million. In 1976 it was over $237 million. By 1980 the total had climbed to $372 million.3 Part of this increase can be attributed to a 1.3 per cent annual growth in population in Metro and to a high rate of inflation. Even if allowance is made for these factors, it is obvious that services are more heavily subsidized than in 1971. It is interesting to note that in the same period the United Way of Greater Toronto increased its allocation to agencies from $10.9 million in 1971 to $12.9 million in 1976 and to $16.8 million in 1981. That is, allocations from voluntary dollars had increased 54 per cent while government expenditures increased 258 per cent in roughly the same period of time.
Similar trends may be found in expenditures on other human services. Education expenditures in Ontario, including those for post-secondary education, rose from $3.2 billion in 1971 to $7.2 billion in 1979.4 Health expenditures in Ontario rose from $2.7 billion to$7 billion during the same period.5 Voluntary contributions, of course, have not been as significant in the health field since the introduction of universal health care in 1959. Just as health care costs have been considered to be a responsibility of government, so has the cost of education, including a high percentage of post-secondary expenditures.
This reliance on public sector spending in traditional philanthropic fields has been much more marked in Canada than in the United States. Bird and Bucovetsky state quite flatly that “the voluntaristic tradition in Canada has always been less significant than in the United States and the tendency to turn to government correspondingly greater”.6
This paper attempts to look at some of these trends in greater detail and from an economic perspective. Part I discusses individual charitable donations from the viewpoint of economic rationality. The ability of both the individual and the corporation to pay for philanthropic activity is examined.
Part II provides further information on the role of the government in funding traditional philanthropic areas and trends in corporate and individual giving are analyzed.
PART I The Economics of Giving
A. Theoretical Framework: Consumer Preference
“Economic man” is considered to operate on a series of assumptions. First, that an individual attempts to maximize his satisfaction at all times. Second, there is an assumption that more things, or goods, provide more satisfaction. Third, if other things are equal and economic man chooses one set of goods, X, over another set of goods, Y, then there is an assumption that he has revealed a preference for X. If, on the other hand, he does not choose X over Y when all other things are equal, he is said to be indifferent, or equally satisfied with either choice.
This simplified view of an individual’s rationale for choosing goods or services provides the framework for our discussion of charitable giving. An individual is assumed to have some personal disposable income after he has provided for the essentials of daily life. This personal disposable income, however large or small, may be used in two ways: it can be saved or it can be donated to some worthy cause or person. The portion saved can remain as savings or it can be used to increase consumption at a later date.
This donation could be made on a purely philanthropic basis, i.e., the donor would not expect an economic return for his donation. Most usually, however, the donor would operate from a “self-interested altruistic” basis.7 He would derive wellbeing, or a sense of satisfaction from his action if some social reward were to be given. This could take the form of increased esteem from collegues,8 payment of social dues,9 the satisfaction derived from salving one’s conscience or the more immediate satisfaction of decreased annoyance from a charitable canvasser.
The simplest form in which the donor can achieve wellbeing or satisfaction is in the form of a direct psychological “utility”. He achieves satisfaction by helping another person. Using Robert Schwarz’s words, “the welfare of B, as a ‘good’ enters A’s utility function on an equal basis with goods personally consumed and A gives according to his utility function, a resource constraint and relative prices.”10
It can be seen that A could enjoy an increased level of satisfaction by ensuring that he is enhancing B’s welfare via his donation. His resource constraint is determined by the size of his personal disposable income and the relative price of the donation is considered to be tax-determined. That is, because charitable donations are taxdeductible, the net cost of donations is the price after the marginal tax rate is considered. The corollary to this is that tax donations are responsive to “price”or the tax system.U
Figure 1
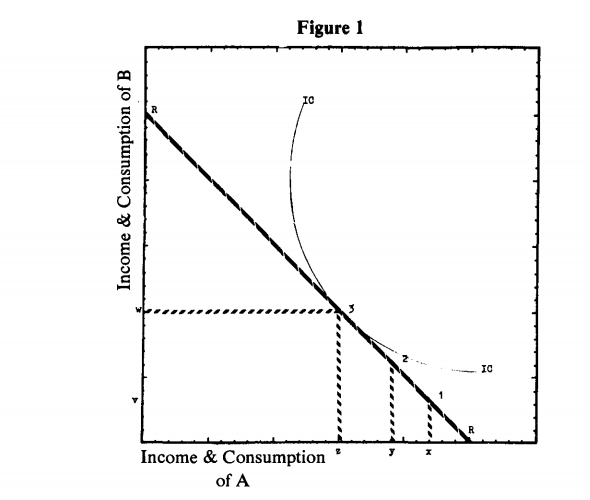
Figure 1 is based on the assumption that A’s utility is a function of his personal consumption and ofB’s consumption. A will try to maximize his utility subject to his income, and will spend his income so that marginal utility derived from a dollar spent on his own consumption is equal to the marginal utility of a dollar given to B.
IC is the highest indifference curve that A can attain. RRis the budget constraint or resource, the slope of which relates the price of A’s giving to the price of personal consumption (not allowing for a tax-determined price of giving). Point 1 pertains when A’s income is x and B’s income is v. Point 3 is where A’s utility is maximized; here he consumes z and gives x-z to B. At Point 2 the income of B increases relative to the income of A. A will then tend to give less to B.(An alternative theoretical framework may be found in Appendix II.)
Preference theory does not offer a complete answer to the reasons behind corporate donations, as the corporation is supposed to be governed more closely by the profit picture. In other words, the corporation will tend to operate in terms of enlightened self-interest.
A corporation may prefer to make a corporate donation rather than have an increased profit if the officers can perceive a benefit to be gained. The corporate officers may choose to exchange charitable donations for community goodwill. Enlightened self-interest may indicate that external benefits could be gained. As an example, local charities could be seen to be aiding employees and improving the community environment.
A corporation could decide that a donation is a preferred expense as it gives satisfaction to corporate managers or officers. For example, a donation to the president’s alma mater provides corporate visibility as well as esteem for that individual executive.12 In some cases a donation may be related to tax policy although this does not appear to be a major factor since few companies in Canada use all of their allowable charitable deductions.
B. Ability to Pay
1. Individual
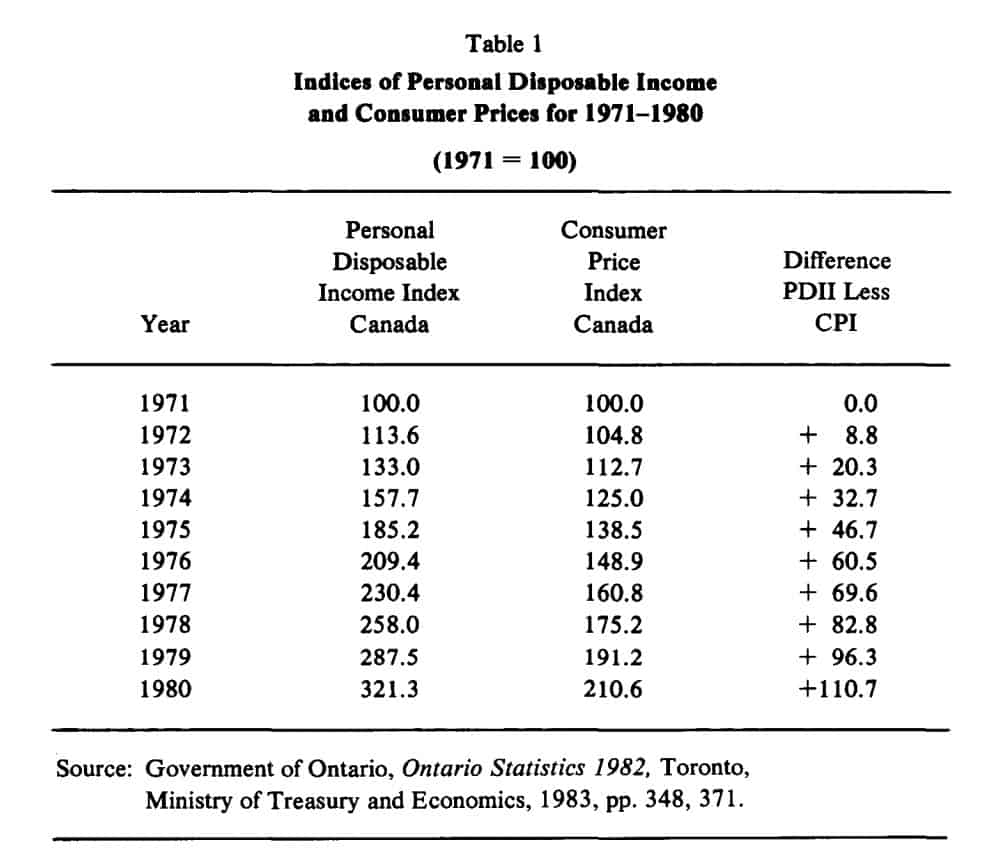
It was noted earlier that the resource constraint on the individual .vas the size of his personal disposable income. However the amount of personal disposable income available to the donor does not by itself show ability to pay. The cost ofliving must be considered as well. Both the personal disposable income index (POll) and the consumer price index (CPI) provide a means of judging whether an individual’s ability to pay is likely to have remained constant during the last 10 years. These Canadian statistics, which measure society’s ability to make donations, serve as a proxy for individual data.
Table 1 shows a Poll (column 1) converted from dollar values given in Ontario Statistics. This index is contrasted with the CPI (column 2) and the difference between the two indices is shown in column 3.
In 1972, thePOIIwas 8.8 index points above the CPl. By 1980 the difference had risen to 110.7 index points difference. That is to say that personal disposable income had increased sharply even after the effects of an increased cost of living had been removed. The individual’s ability to pay for donations appears to be much greater now than in 1971.
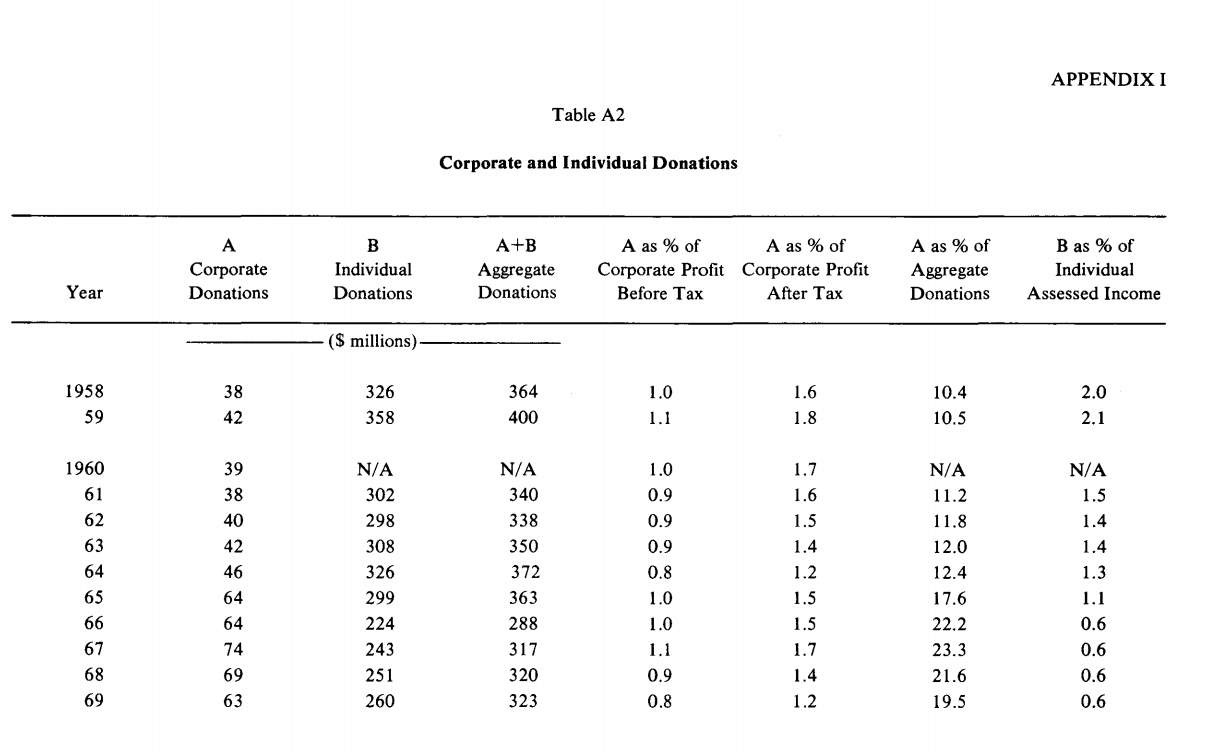
Another measure of the individual’s ability to pay can be found in Table 2. This table shows total individual donations as a percentage of total individual assessed income.
This table indicates very clearly that individual donations during the period 1958 to 1980 steadily dropped as a per cent of assessed income. In 1958 individual
Table I
donations were 2.0 per cent of assessed income. This percentage declined until 1970 when it reached the 0.5 per cent mark, where it has remained ever since. It can be seen that the dollar value of individual donations fluctuated somewhat but is now much higher in current dollars than it was in 1958.
The total of individual assessed income in 1958 was $16 billion, increasing to $210 billion in 1980. This represents four times the increase in donations during the same period. Again the individual’s ability to pay does not appear to have declined.
2. Corporate
The resource constraints on a corporation are usually considered to be determined by the profit made by the corporation. The profit picture may be altered by the imposition of taxes and thus could conceivably reduce the corporation’s ability to pay.
Table 3 shows corporate donations in Canada from 1958 to 1980 in dollars, as a percentage of corporate profits before tax and as a percentage of corporate profits after tax.
Several things are to be noted in this table. Again the dollar value of the donations has increased markedly from the 1958 base. In fact corporate donations rose 416
Table 2
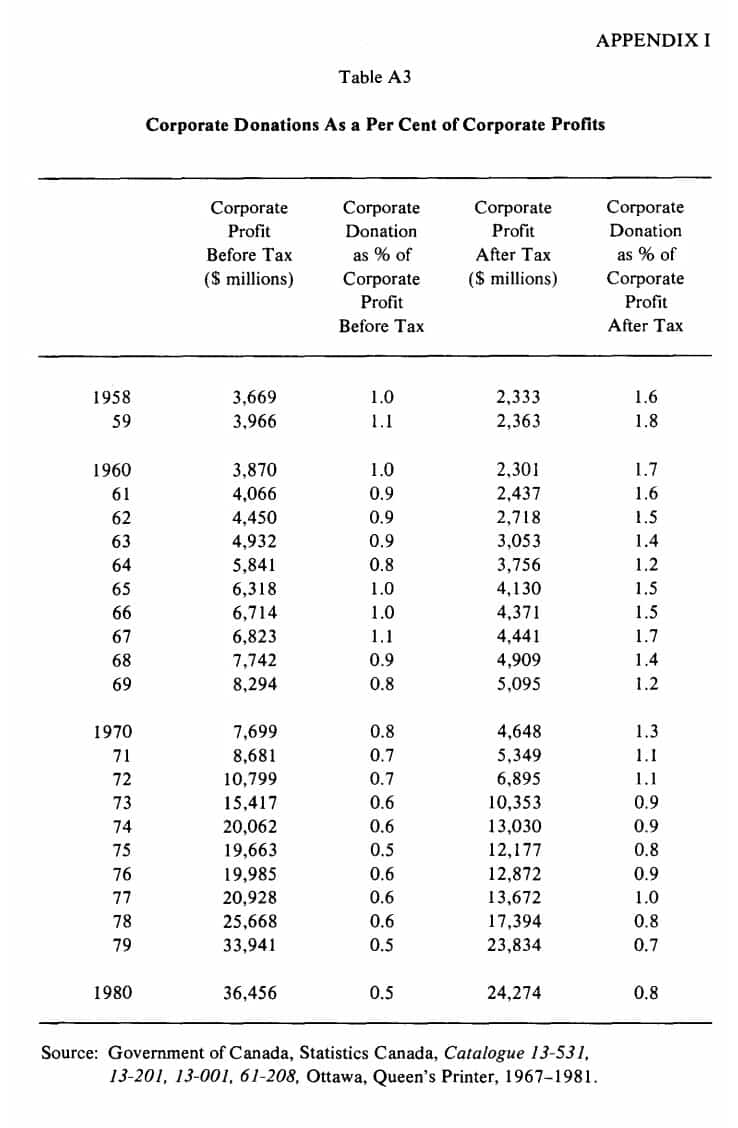

per cent in the period compared with a 222 per cent rise in individual giving. Most importantly, the rate of giving has decreased at the same proportionate rate whether one looks at corporate profits before or after tax.
Barbara Michalos uses a similar series of data to point out the progressively downward trend in the contribution rate even during economic boom times.13 1t is difficult to infer from this that profits, as budget constraints, play a very large role in the granting of corporate donations. Certainly the lack of profits will preclude a company from contributing to philanthropy but large profits do not always seem to mean larger donations. Michalos suggests that when profits decline, contributions will decline proportionately but when profits increase, contributions increase marginally rather than proportionally.14 This appears to be borne out by the experience of volunteer canvassers of the United Way of Greater Toronto.
Experience of the United Way can also shed further light on the relationship between donations and ability to pay. A study conducted in 1979 is reproduced to show how employee donations and average wages and salaries are connected. (Table 4)
Selected industry groups (SIG) are listed in descending order of their average employee per capita donation. For example, the employees of the motor vehicle group give an average per capita gift of$36.05 while employees of the transportation industry give an average gift of$5.67. When the industrial groups are ranked by their average wages and salaries it is clear that the rankings are not similar. For example, motor vehicles employees are first in per capita giving but third in average wages and salaries. Metal/mines employees are nineteenth in per capita employee giving but are second in average wages and salaries. In summary, this table indicates there is no direct relationship between the giving by an average employee giving in a particular industry and the average wages and salaries of that industry.
PART II
A. Social Services
Role of the Government in Philanthropy
As was noted in the introduction, government social services have expanded very rapidly in the last decade. The greatest period of growth was in the early Seventies when economic conditions were buoyant, the threat of the OPEC cartel seemed unlikely to last and it appeared that society could indeed afford to expand social services.
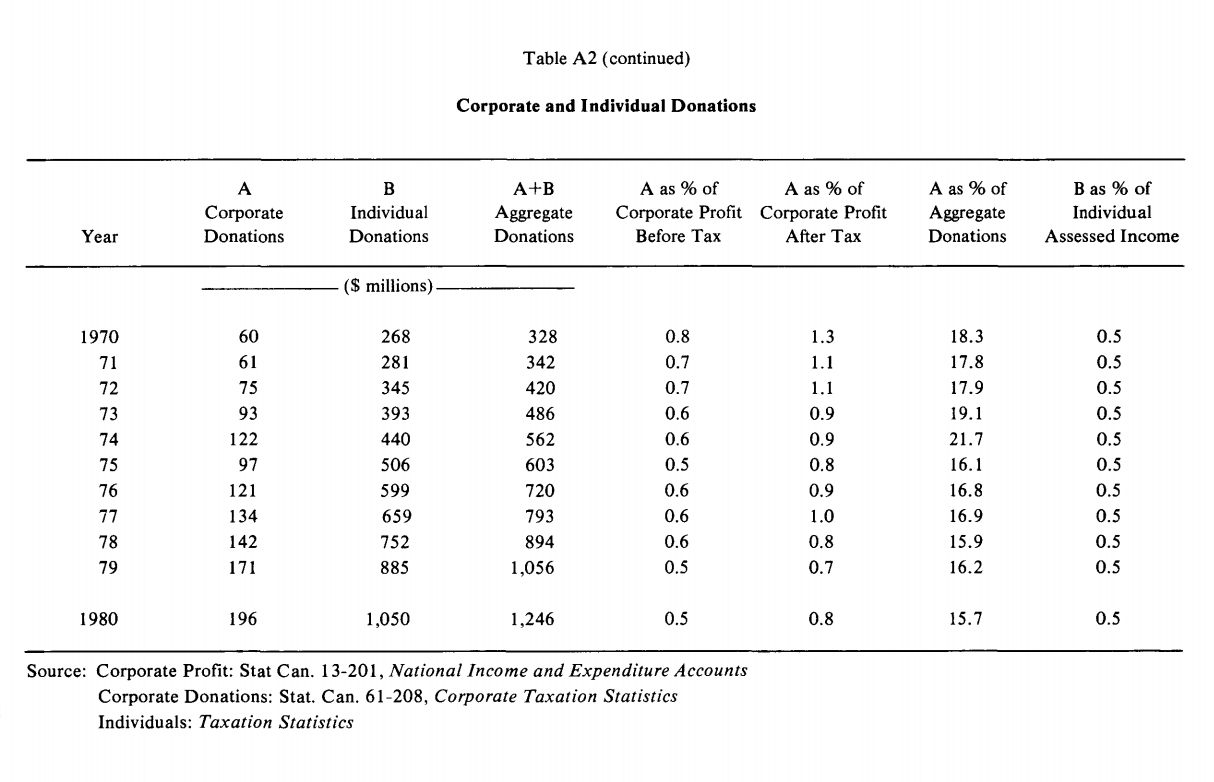
Table 5 depicts this situation quite graphically.It shows the Ontario expenditures on personal social services (excluding income maintenance) for the years 1971 to 1976. Values are given in current and constant dollars, showing an absolute increase in tax dollars on personal social services.
The services are those which have historically been the concern of charitable, nonprofit, private organizations. In some cases the government has been pressured to assume responsibility-as an example most health services such as those provided by the Victorian Order ofNurses have been considered to be the territory of
Table 4
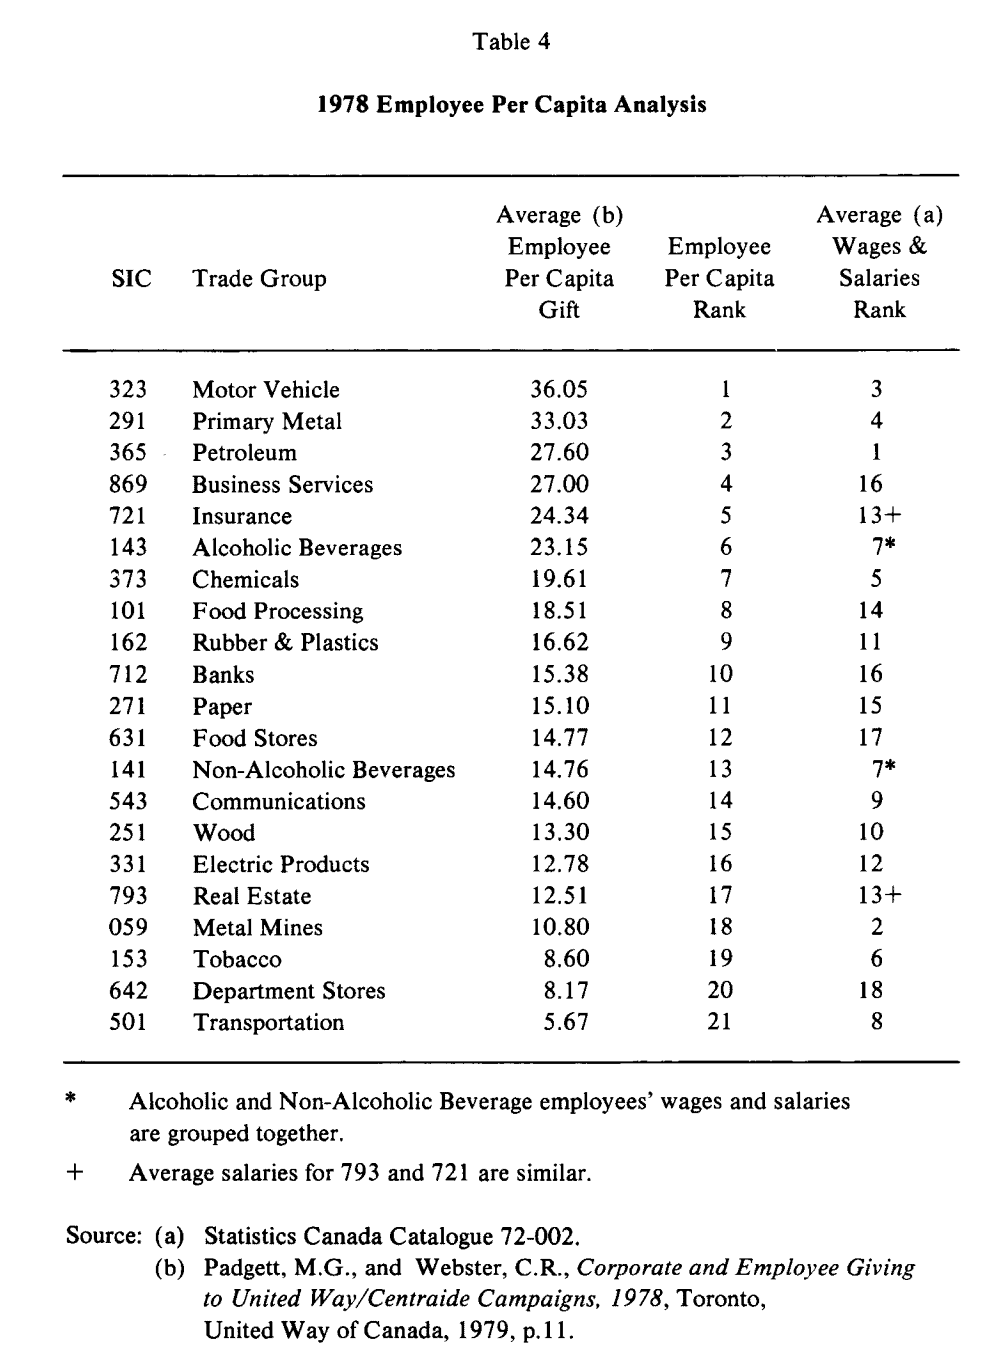
Table 5

government. The United Way of Greater Toronto led several delegations to persuade the province to accept greater responsibility.
In other areas, such as day care, the province and municipalities have been reluctant to accept responsibility. Unfortunately, so have the non-profit funding agencies with the result that private commercial operators have tended to dominate the field.
B. Other Policy Fields
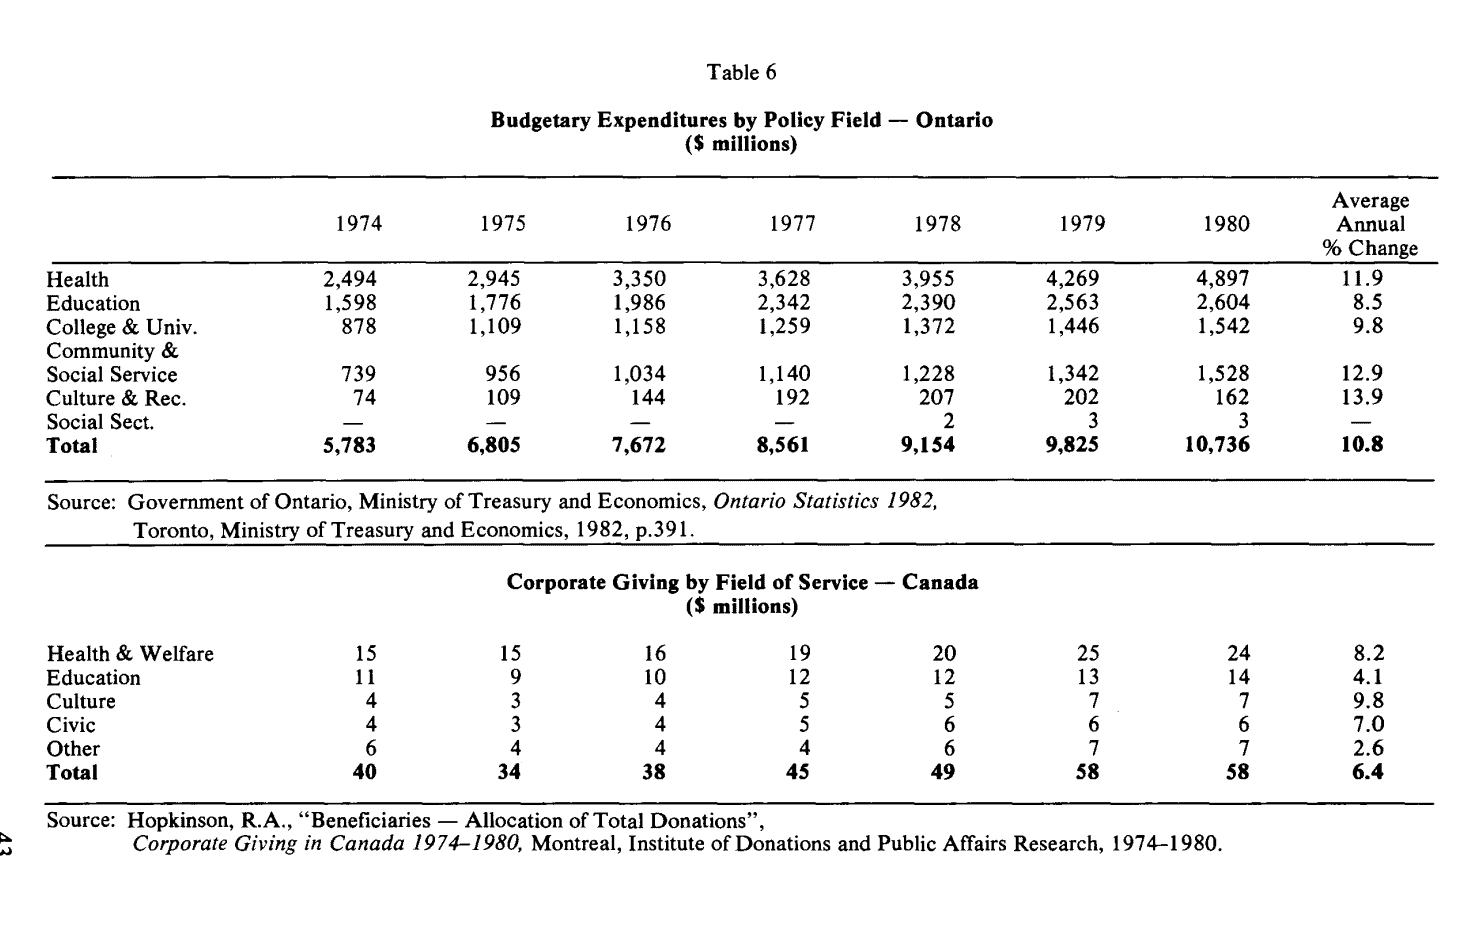
Social services is not the only policy field in which governmental expenditures have outstripped donations. An interesting comparison can be made between budgetary expenditures by policy fields in Ontario and corporate donations in Canada. In Table 6 corporate donations show fields of service roughly comparable to the policy fields in Ontario. Although the data are for different jurisdictions the assumption is made that the trends are valid, especially because so many corporations are based in Ontario. Table 6 compares expenditures in the various fields of service in the years 1974 to 1980. The total expenditure increased from $5,783 million in 1974 to $10,736 million in 1980, an average annual increase of 10.8 per cent. A similar breakdown is listed for corporate giving in Canada. During the same period it is seen that corporate giving moved from $40 million to $58 million, an average annual increase of 6.4 per cent or 4.4 per cent lower than the annual increase in government expenditure.
Government health expenditures in Ontario increased at roughly one and one half times the rate at which corporations donated to this field in Canada. Similarly, the policy fields of education and colleges and universities showed an increase nearly double the rate of corporate donations to education.
In all fields, there has been a much greater increase in government expenditures than in corporate donations. It can be postulated that government expenditures are a close substitute for philanthropic giving and can thus displace many of the charitable endeavours which have flourished in the past. This idea is based on the concept that the individual who is solicited for organized charity may believe that he is responding to coercion and thus paying a form of taxation. Since government expenditures would provide more coverage, supposedly at a more economic cost because of the greater base, it is understandable that many donors would not respond to pleas for greater assistance to the voluntary sector.
This attitude is now causing a great deal of concern t!l government and voluntary agencies alike. Many governments are now wishing to retreat from heavy budget expenditures on items once considered private-sector responsibilities. Unfortunately, many agencies and organizations such as United Ways, colleges and hospitals are finding it increasingly difficult to raise sufficient funds to replace government grants.
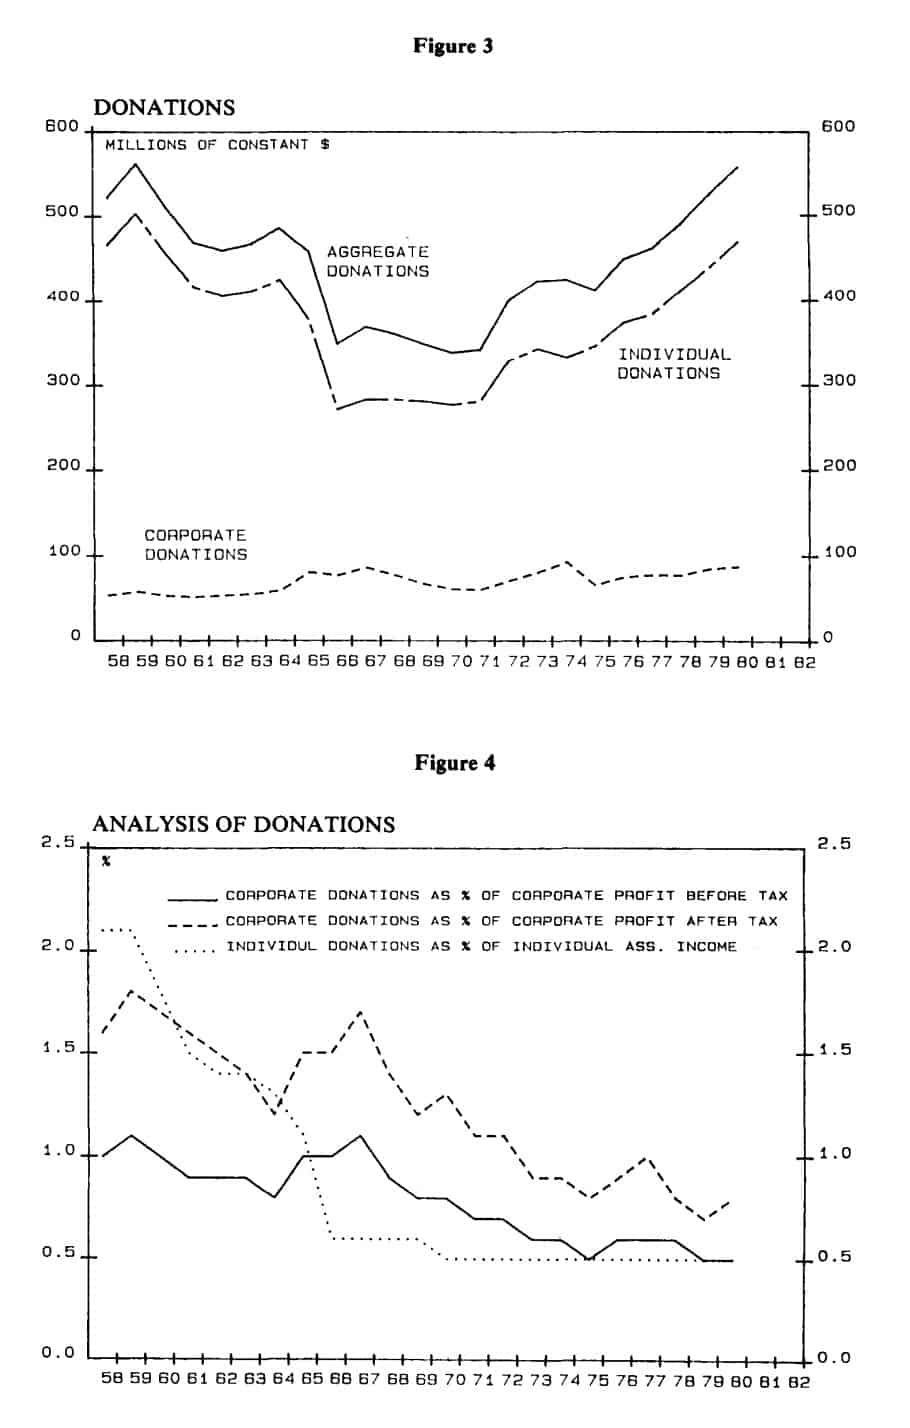
This may be seen in Figures 2 and 3. Figure 2 is a plot of corporate, individual and aggregate donations from 1958 to 1980 in current dollars. The individual donations curve shows a strong growth pattern while the corporate donations curve shows relatively slow growth. Figure 3 removes the effect of inflation and plots the same donations as in Figure 2 in constant 1971 dollars. This graph shows only
Table 6
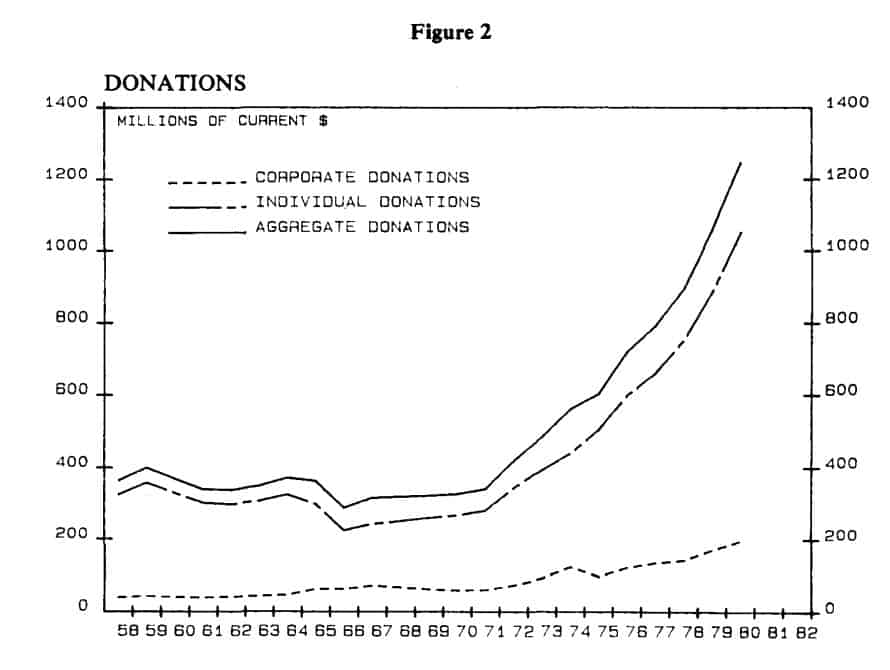
minimal growth in the corporate donations, while individual donations dipped in the mid Sixties and did not climb back to the 1958 level until 1980.
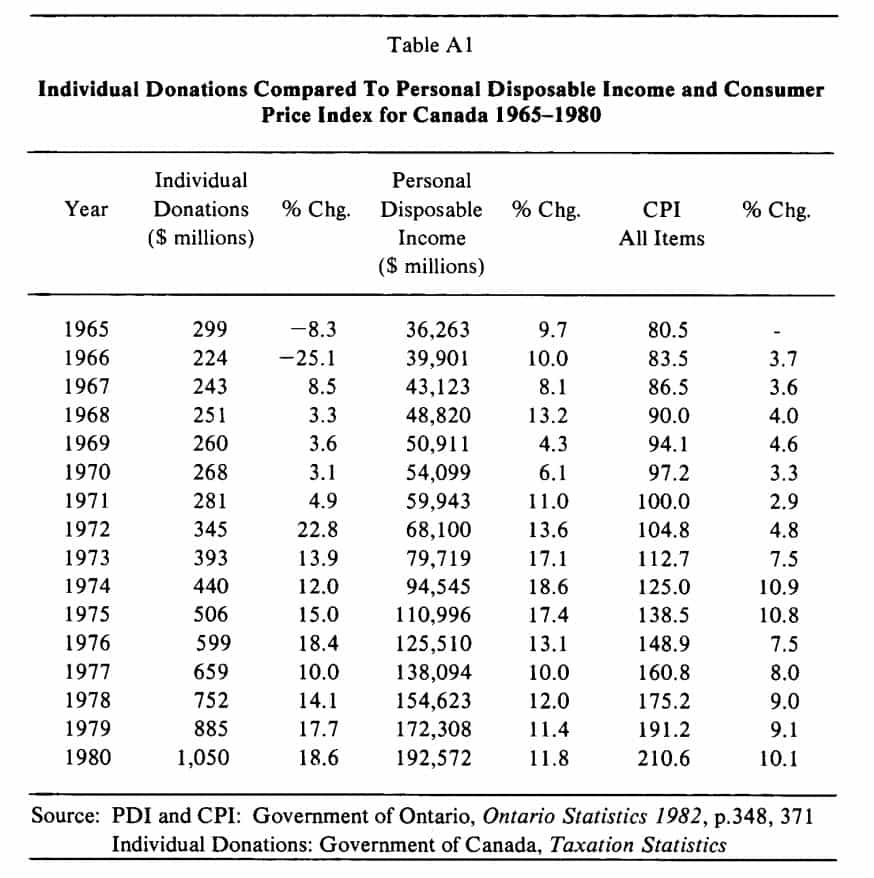
Figure 4 shows a plot of corporate donations as a per cent ofboth before- and aftertax corporate profits. Individual donations are shown as a per cent of individual assessed income as reported by Revenue Canada. All three categories have declined in 1980 to less than one half of their 1958level. The downward trend has been gradual and has levelled off in recent years.
These trends are in agreement with data described in a Canadian study by R.D. Hood, S.A. Martin and L.S. Osberg. This study showed that the estimates for price elasticities for individual charitable donations were much smaller than estimates made in the United States. Income elasticities were only slightly lower than American estimates.15 J.A. Johnson, in discussing this study comments that “if these estimates are correct, the proportion of income given to charitable organizations will fall over time as incomes increase”.16
There does not seem to be much cause for optimism when one looks at traditional philanthropic fields. Government spending has become increasingly more important until during the Seventies it displaced many types of private philanthropy. Leaders of the United Way and other fund-raising organizations initially saw government involvement as a chance for voluntary organizations to change their focus, expand their boundaries, and develop innovative approaches to emerging needs. These opportunities could only be seized if there was a steady commitment from government and a steady or increasing response from the voluntary sector. Instead, it may be that governments are now unable to maintain their heavy mon-
Figure 3
etary commitments to social and health services, education and culture.17 It also appears that voluntary donations are unlikely to reach previous levels. The result of this impasse is that social services, in particular, may have difficulty in maintaining existing services or acquiring additional funding until a new equilibrium is established between government and the voluntary sector.
FOOTNOTES
1. Expenditures by Counties, Toronto, Ministry of Community and Social Services, Government of Ontario, 1972 and 1977.
2. Ontario Statistics, Toronto, Ministry of Treasury and Economics, Government of Ontario, 1983, pp.116, 117.
3. Ibid., p.119.
4. Ibid., p.210.
5. Ibid., p.136.
6. Bird, R.M., and Buscovetsky, M.W., Canadian Tax Reform and Private Philanthropy, Toronto, Canadian Tax Foundation, 1976, p.4.
7. Tinari, Frank D., “A Theoretical Foundation for the Empirical Analysis of Household Monetary Donations: A Note”, American Economist, 22, Spring 1978, p.73.
8. Levy, Ferdinand K. and Shatto, Gloria M., “Evaluation of Corporate Contributions”, Public Choice 33(1), p. 24.
9. Footnote 6, supra.
10. Schwarz, Robert A., “Personal Philanthropic Contributions”, Journal of Political Economy, 1970, p.1265.
11. Hood, RD., Martin, S.A. and Osberg, L.S., “Economic Determinants of Individual Charitable Donations in Canada”, Canadian Journal of Economics, X(4), p.666.
12. Footnote 8, supra.
13. Michalos, Barbara L., “Canadian Corporate Charitable Contributions: Trends and Policies”, Social Indicators Research 9 ( 1981), p.141.
14. Ibid., p. 141.
15. Footnote 11, supra, pp. 653-669.
16. Johnson, J. A., The Determinants of Charitable Giving with Special Emphasis on the Income Deduction Under the Income Tax-A Survey of the Empirical Literatures, Hamilton, McMaster University, Department of Economics, 1982, p.10.
17. “Walker Urges Handover of Some Social Services”, The Globe and Mail,
Toronto, March 4, 1982.
APPENDIX I
Additional Tables
Table A1 Individual Donations Compared to Personal Disposable Income and Consumer Price Index for Canada 1965-1980
Table A2 Corporate and Individual Donations
Table A3 Corporate Donations As a Per Cent of Corporate Profits
Table A4 Ontario Social Services Expenditures, $ Per Capita 1975-1980
Table AS United Way Per Capita Contribution-Selected Cities 1975-1982
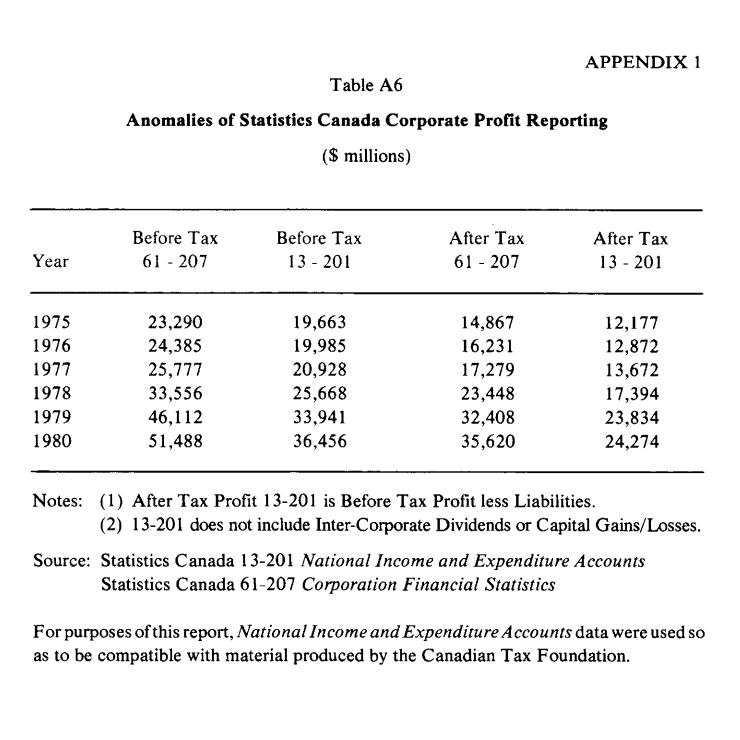
Table A6 Anomalies of Statistics Canada Corporate Profit Reporting 1975-1980
Table A7 Corporate and Employee Giving Related to Total United Way of
Greater Toronto Campaign Receipts 1975-1982
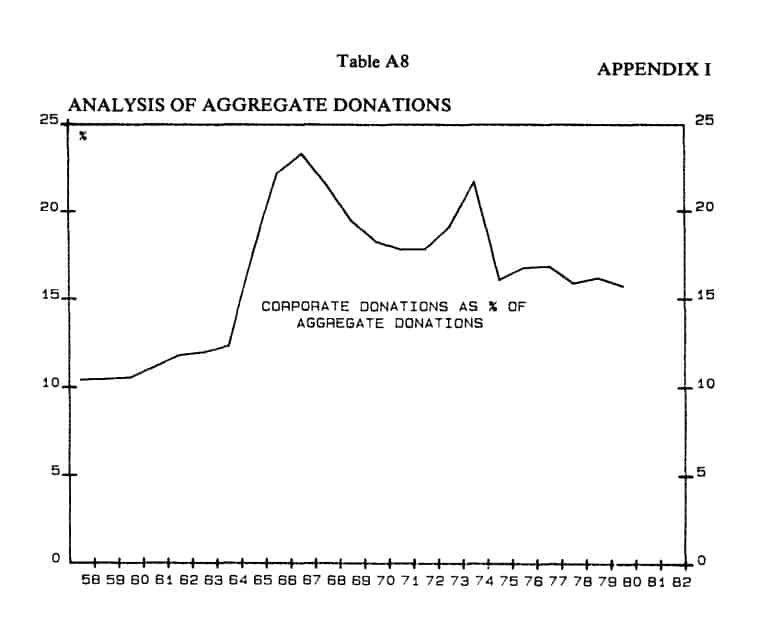
Table AS Analysis of Aggregate Donations 1958-1980
Table AI

APPENDIX II
Supply and Demand in Philanthropy
An alternative theoretical framework could be used in place of the preference theory. This approach would employ supply and demand concepts to provide a rationale for philanthropic donations. This theory would be most applicable to individual cases of charity.
If charitable donations are analysed in terms of supply and demand (Figure 5) it may be assumed that A demands units of welfare and B supplies units of welfare. In other words the supply of units of welfare affects directly the relative conditions of B. IfB becomes worse off, the supply curve will shift to the right; conversely ifB becomes better off the supply curve will shift to the left.
A has a preference for the”good feeling” he gets from giving to B; therefore, he will demand units of welfare, the price being established by B’s relative condition.
Demand curveD is A’s demand for units of welfare. Supply curves S are the units of welfare supplied by Band are at equilibrium E where price is P and quantity is Q. IfB’s condition worsens the supply curve will move to S1 where the equilibrium is Eland the Price is Pl (less than P) and the quantity is Ql (more than Q). AtEl, A is able to purchase more units of welfare for less money. However, ifB’s lot in life improves his supply curve will move to S2 with an equilibrium ofE2. Here A pays a higher price P2 for fewer Q2 units of welfare.
Figure 5
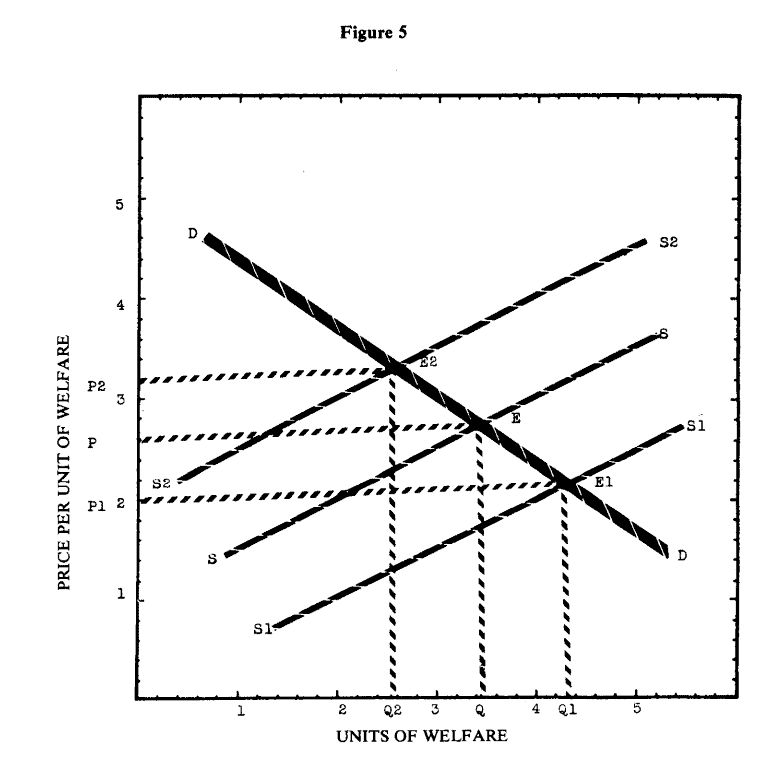
This is, of course, an oversimplified version of demand and supply theory since socio-economic variables such as age or sex are not considered. If all variables were considered, an econometric equation could be used to estimate the relationship between these variables and charitable contributions.
Books
SELECTED BIBLIOGRAPHY
Bird, R.M., and Bucovetsky, M.W., Canadian Tax Reform and Private Philan thropy, Toronto, Canadian Tax Foundation, 1976.
Council of Economic Advisors to the Joint Economic Committee, Economic Indicators, Apr 1982, Washington, United States Government Printing Office, 1982.
Corporate Philanthropy, Washington, Council on Foundations, 1982.
Deeg, J.F., How and What Canadians Contribute to Charity, Toronto, Canadian Centre for Philanthropy, 1982. (see alsop. 3 this issue)
Hopkinson, Richard, A., Corporate Giving in Canada, Montreal, The Ryerson Group Limited, 1974.
Hopkinson, Richard, A., Corporate Giving in Canada, Montreal, The Institute of Public Affairs Research, 1975, 1976, 1979, 1981.
Johnson, J.A., The Determinants of Charitable Giving with Special Emphasis on the Income Deduction under the Income Tax-A Survey of the Empirical Literatures, Hamilton, McMaster University, Department of Economics, 1982.
Kapelos, G., Review of Member Agencies’ Services: Towards an Understanding of the General Impact Due to Limited Funding,Toronto, United Way of Greater Toronto, 1980.
Martin, Samuel, A., Financing Humanistic Services, Toronto, McClelland and Stewart Limited, 1975.
Murphy, Dennis, J., Corporate Contributions: Understanding the DecisionMaking Process, Alexandria, Virginia, United Way of America, 1982.
Padgett, M.G. and Webster, C.R., Corporate and Employee Giving to United Way/Centraide Campaigns 1978, Ottawa, United Way/Centraide Canada, 1979.
Analysis of Corporate and Employee Giving by Trade Groups in 1978 United Way Campaigns, Alexandria, Virginia, United Way of America, 1979.
Articles
Abrams, B.A. and Schitz, M.D., “The Crowding-Out Effect of Government Transfers on Private Charitable Contributions”, Public Choice 33, 1978, pp.29-39.
Arrow, J.K., “Gifts andExchanges”,Philosophy and Public Affairs, Summer 1972, pp. 343-362.
Bennett, J.T. and Johnson, M.H., “Corporate Contributions: Some Additional Considerations”, Public Choice 35, 1980, pp.137-143.
Fisher, Franklin M., “On Donor Sovereignty and United Charities”, American Economic Review 67, Spring 1977, pp.632-638.
Feldstein, M. and Baskin, M.J., “Effects of the Charitable Deduction on Contributions by Low Income and Middle Income Households: Evidence from the National Survey of Philanthropy”, Review of Economic Statistics 59, August 1977, pp.351-354.
Hood, R.D., Martin, S.A., and Osberg, L.S., “Economic Determinants of Individual Charitable Donations in Canada”, Canadian Journal of Economics, November 1977, pp.653-669.
Keating, Barry, Pitts, Robert, and Appel, David, “United Way Contributions: Coercion, Charity or Economic Self-Interest?”, Southern Economic Journal47, January, 1981, pp.816-823.
Keirn, Gerald D., Meiners, Roger E., and Frey, Louis W., “On the Evaluation of Corporate Contributions”, Public Choice 35, 1980, pp.192-136.
Levy, Ferdinand K. and Shatto, Gloria M., “The Evaluation of Corporate Contributions”, Public Choice 33, 1979, pp.19-27.
Michalos, Barbara L., “Canadian Corporate Charitable Contributions: Trends and Policies”, Social Indicators Research 9, 1981, pp.127-153.
Rabinowitz, Herbert S., Simmeth, Bruce R, and Spero, Jeannette R, “The Future of United Way”, Social Services Review 53, June 1979, pp.275-284.
Rose-Ackerman, Susan, “United Charities: An Economic Analysis”, Public Policy 28, Summer 1980, pp.323-350.
Schwarz; Robert A., “Personal Philanthropic Contributions”, Journal of Political Economy, 1970, pp.1264-1291.
Singer, Peter,”Altruism and Commerce: A Defence ofTitmuss Against Arrow”, Philosophy and Public Affairs, Spring 1973, pp.312-320.
Smith, David Horton, “The Role of the United Way in Philanthropy”, Research Papers Vol. II, Part II, The Commission on Private Philanthropy and Public Needs, Washington, 1977.
Sundel, Harvey, Zelmar, William N., Weaver, Charles N., and Pasternak, Richard E., “Fund-Raising: Understanding Donor Motivation”, Social Work 23, May 1979, pp.223-226.
Tinari, Frank, D., “A Theoretical Foundation for the Empirical Analysis of Household Monetary Donations: A Note”, American Economist 22, Spring 1978, pp.72-76.
C.R. WEBSTER
Manager, Information Services
United Way of Greater Toronto