Introduction
Identifying changes in donor motivations and barriers is important for many reasons, including helping fundraisers adapt requests for support to changing circumstances and providing charity leaders and other stakeholders with insight into emerging sector issues. In this column, I draw on data from the Canada Survey of Giving, Volunteering, and Participating (CSGVP) to give a brief overview of what is known about recent changes in donor motivations and barriers. I then focus in greater detail on the most significant change—the increase in the number of donors reporting that they did not donate more because they believed that the money would not be used efficiently.
Motivations and Barriers to Charitable Giving
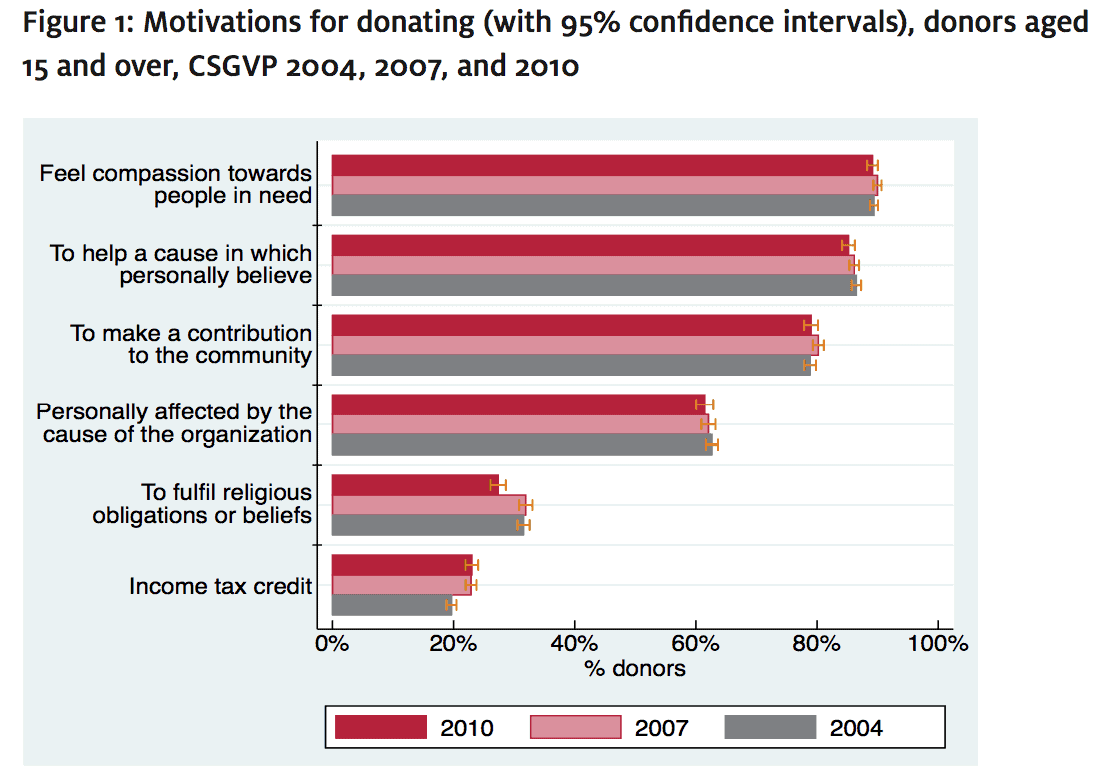
The CSGVP assesses what motivates donors by asking whether each of six possible motivations was important to them. Figure 1 shows the percentages of donors who reported each of these motivations in the 2004, 2007, and 2010 surveys. As can be seen from the high level of confidence in the responses (i.e., the 95% confidence intervals1 ) there are only a few shifts between surveys that are larger than the degree of uncertainty. These statistically significant shifts (i.e., shifts that are unlikely to be due purely to random factors related to the uncertainty of survey-based research) include the following:
• the jump in 2007 over 2004 in the percentage of donors citing the importance of the tax credit they receive in return for their donations,
• the drop in 2010 over 2007 in the percentage of donors reporting the importance for their giving of religious obligations or beliefs, and
• the overall gradual decrease in donors reporting the importance of the desire to help a cause in which they personally believe.
However, although some shifts are statistically significant, substantially none of the motivations show noticeable, consistent shifts over time.
figure 1
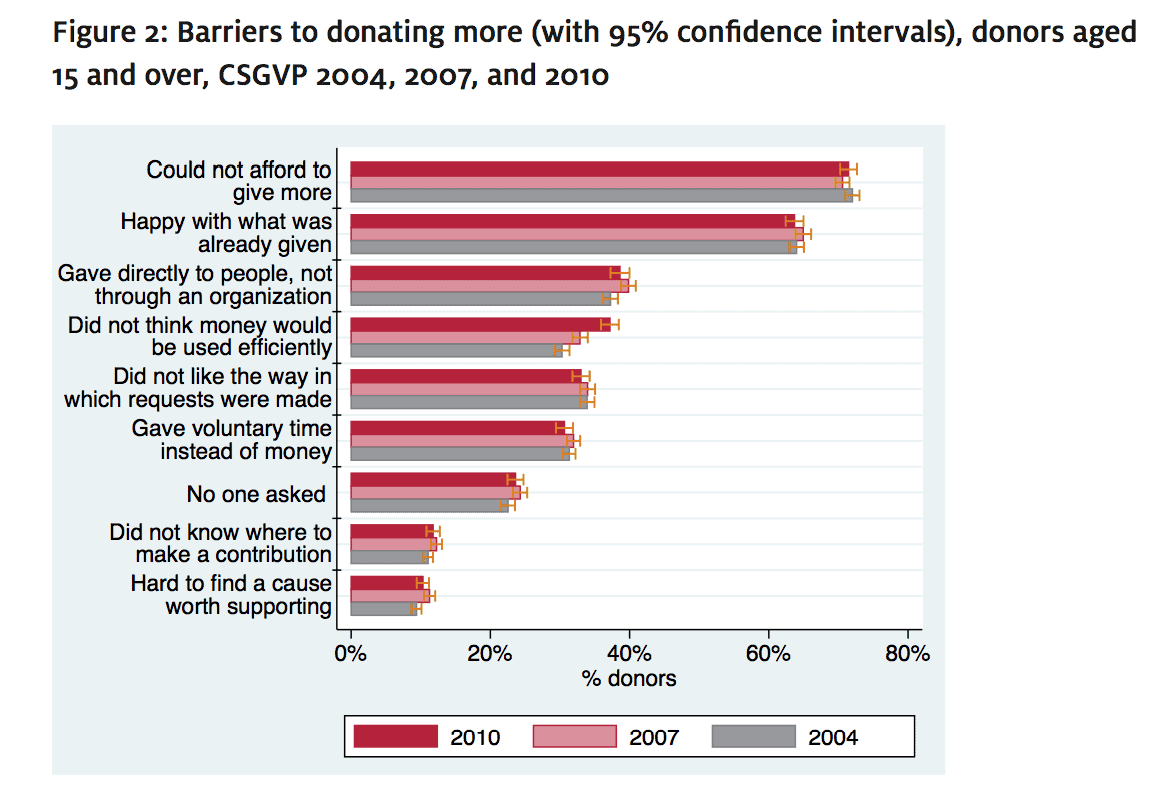
Similar to the way it assesses donor motivations, the CSGVP asks donors whether each of nine possible barriers prevented them from donating more money than they did. As with the motivations, there are few clear indications of significant trends in the importance of these barriers over time. Although many survey-to-survey shifts reach statistical significance, these shifts frequently reverse themselves and do not show consistent directional change over time. The one notable exception is the steady increase in donors reporting they did not donate more because they did not believe that their money would be used efficiently. The percentage of donors reporting this barrier has increased markedly, from 30% of donors in 2004 to 33% in 2007 and 37% in 2010.
figure 2
Concerns about efficiency as a Barrier to Giving More
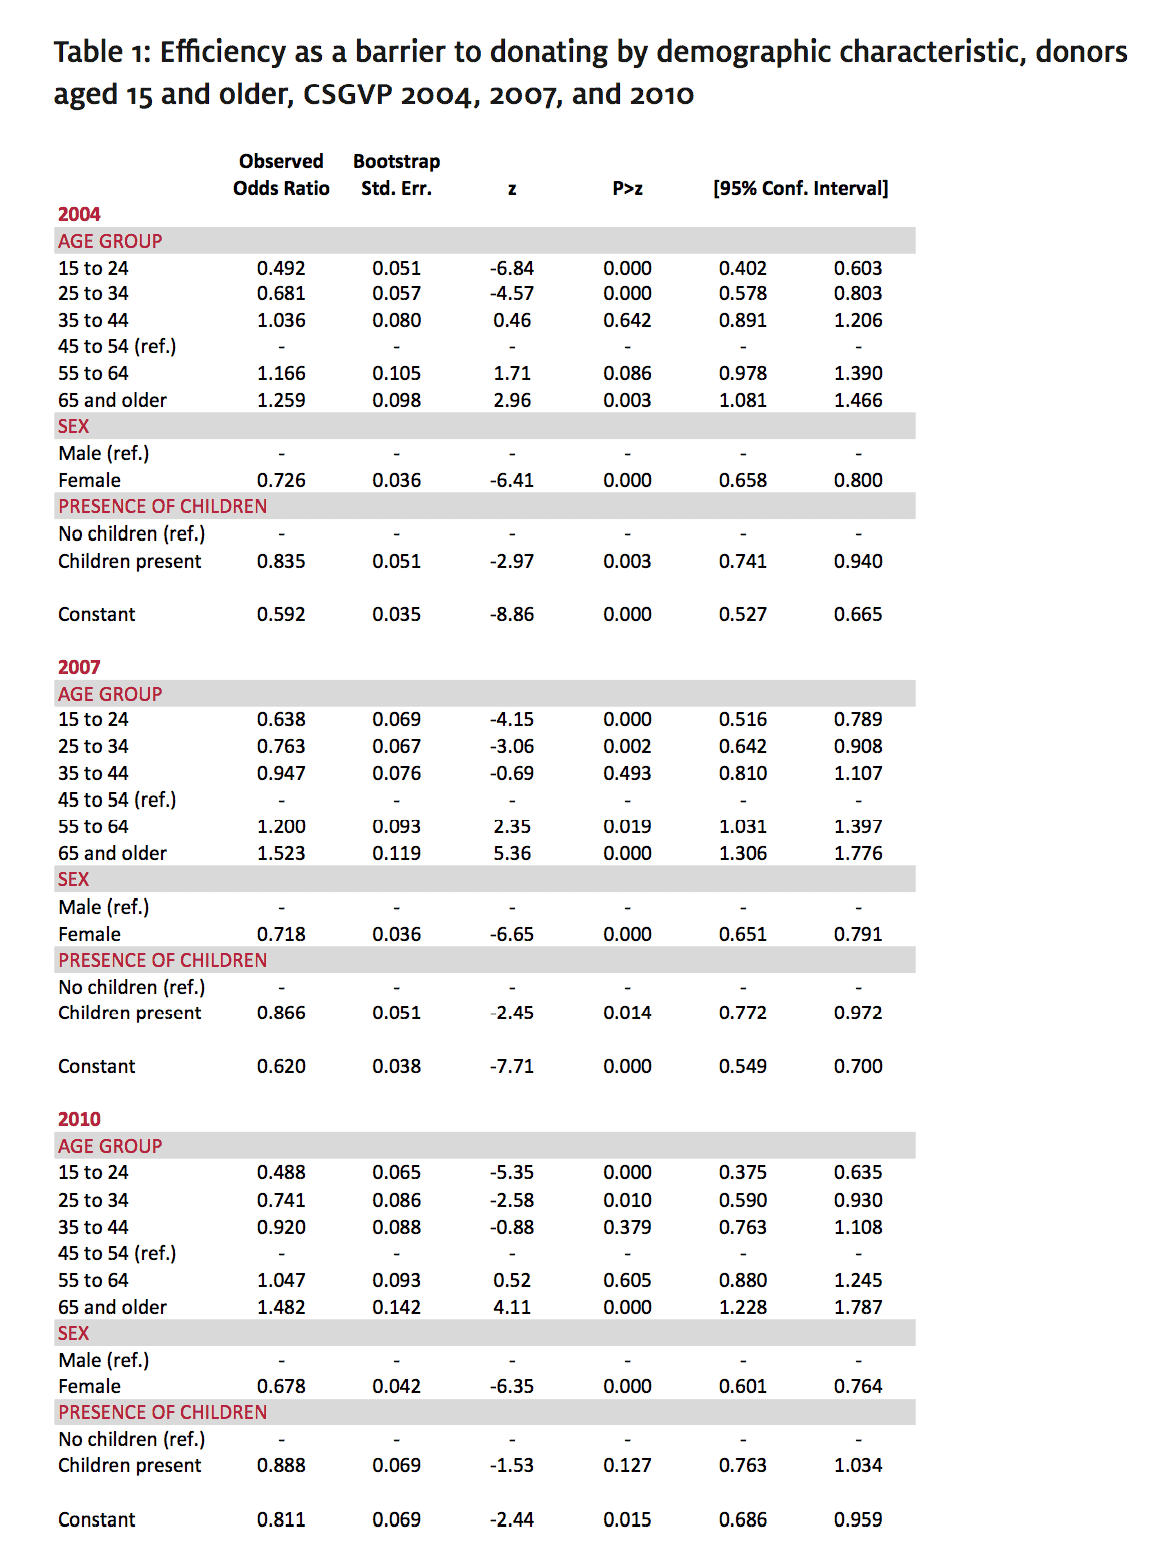
Given the increase in the number of donors reporting this barrier, it seems useful to try to identify what might be driving this trend. Looking first to the demographic characteristics, it is clear that some donors are more likely than others to report this barrier. Consistently over the three waves of the survey, those who were older, male, and had children present in the household were more likely to report this barrier (see Table 1).2
Other demographic characteristics that are frequently very important predictors of giving, such as frequency of religious attendance, marital status, and level of educational attainment, are either not statistically significant or show inconsistent patterning from survey to survey.
table 1
Although the above-mentioned groups of donors were more likely to report this barrier, they did not appear to play a disproportionate role in driving the increase from survey to survey. For example, Figure 3 shows the predicted likelihood by age group of donors saying they did not donate more because of concerns about how efficiently the money would be used. All three years of the survey show similar patterns, with the likelihood of reporting this barrier increasing more or less steadily by age group. The generally parallel nature of the lines indicates that all age groups contributed more or less equally to the increase in the number of donors reporting this barrier. Similar patterns are seen with sex and with the presence of children in the household (i.e., both men and women and those with and without children in the household contributed roughly equally to the increases from cycle to cycle).
figure 3

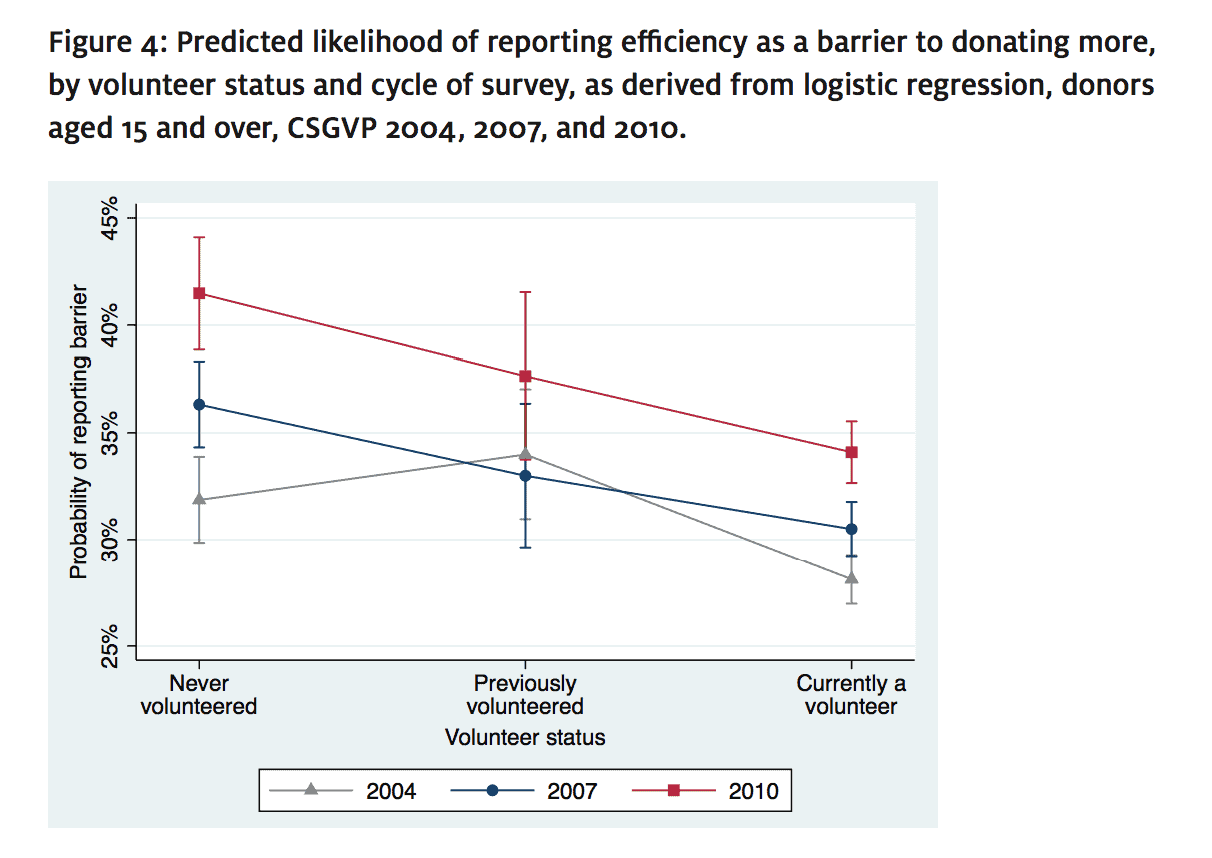
Other factors beyond the demographic characteristics of donors also influenced the likelihood of reporting this barrier. For instance, there appear to be associations with the experiences donors had during their youth. Donors who had a parent who was involved in volunteering, who canvassed for an organization, or who volunteered themselves during their youth were less likely to report efficiency concerns as a reason for not donating more. The amount donated also appears to play a role. When donors are divided into quartiles based on the amounts they donate (i.e., the 25% who donate the smallest amounts annually, the 25% who donate larger amounts, the 25% who donate even larger amounts, and the 25% who donate the largest amounts), the likelihood of reporting the barrier increases with the amount donated. Donor health also appears to be related, with the likelihood of reporting this barrier increasing as donor satisfaction with health decreased. The single most significant non-demographic factor appears to be volunteer status. Figure 4 shows the predicted likelihood of reporting the barrier by volunteer status. It indicates that those who had volunteered for a charitable or nonprofit organization within the previous year were markedly less likely to report efficiency concerns as a barrier than were those who had never volunteered. They were also somewhat less likely to report the barrier than those who had volunteered at some point prior to the previous year (i.e., who were not volunteers at the time of the survey but who had volunteered at some previous point in their lives).
While all of these non-demographic variables independently have statistically significant associations with the likelihood of reporting this barrier, when their effects are combined with demographic variables, only volunteer status remains independently significant. Respondent demographics appear to account for much of the variability associated with health satisfaction, and donation amount and volunteer status appears to account for much of the variation associated with youth experiences around volunteering. These associations should still be kept in mind, but they are not as powerful predictors as the other factors.
figure 4
Summary and Conclusion
There are two key takeaways from this data. The first is that the motivations and barriers of donors, at least as measured by the CSGVP, generally appear to be relatively slow to change. There are very few long-term trends currently identifiable and most appear to be slow moving. Efficiency concerns appear to be the major exception. The second is that CSGVP data do not show much about what is driving the increase in efficiency concerns. We know that donors with particular demographic characteristics are more likely to report this barrier and that some early life experiences and actions are correlated with reduced likelihood of reporting the barrier, but there is little definite evidence in the survey of exactly what factors are the prime movers. That said, it is intuitively reasonable to suggest that media focus on the issue probably plays a major role. That volunteers and past volunteers are less likely to report the barrier suggests that donors who have greater familiarity and direct exposure to the operations of charities are somewhat inoculated against this public narrative. This in turn indicates that if we wish to counter the rise of perceptions around efficiency as barrier, we need to be more effective at explaining our case to the public. This may pose particular challenges, in that there is a growing sense within the sector that we need to educate the public as to the primary importance of organizational effectiveness, shifting the conversation away from one that focuses on efficiency.
Notes
1. Indicated by the double-ended gold error bars at the end of each individual bar.
2. Table 1 presents the results of a logistic regression of those reporting this barrier against the significant demographic variables. The analysis compares the likelihood of reporting the barrier across different demographic categories. Each group is compared against a reference category (those aged 45 to 54, men, and those with no children in the household). The first column presents the observed odds ratio—values greater than 1 indicate that donors with this characteristic were more likely than those in the reference category to say they did not give more because they thought the money would not be used efficiently, while values less than 1 indicate that they were less likely to say this than those in the reference category. The column labelled P>z indicates the statistical significance of the association.
David Lasby is Director of Research, Imagine Canada, 2 Carlton Street, Suite 600, Toronto, ON m5b 1j3.
Email: dlasby@imaginecanada.ca .