Introduction
The research presented in this article answers the question of where and how funding is being channelled in the environmental sector in Canada. The environmental grants database, compiled and analysed by researchers at the Canadian Environmental Grantmakers’ Network, documents how grant dollars in the year 2007 were allocated by environmental issue, activity, location, and recipient type. By making available this information to the environmental community, it is hoped that the analysis, debate, and exchange of information will be improved, and will ultimately encourage collaborative action to address shared philanthropic goals. The environmental grants database project received support from the Max Bell Foundation, the Ontario Trillium Foundation, and one anonymous donor.
The Canadian Environmental Grantmakers’ Network is a membership group that includes private, community, and corporate foundations, as well as government and corporate funding programs that give environmental grants in Canada. The Canadian Environmental Grantmakers’ Network’s mission is to expand the scope and effectiveness of grantmaking in support of the Canadian environment.
A common question of those providing grants in a sector is how their funding contribution fits into the broader picture of grantmaking in that sector. Additionally, many funders may wonder whether their funds are being channelled wisely, and if the strategic coordination of funds may advance their philanthropic goals more expediently. And in the environmental sector, the need for expedient action is critical. As environmental issues move into mainstream consciousness, they also become increasingly complex, leaving philanthropists and the general public alike perplexed as to which particular issues are most deserving of imminent action. One piece of the puzzle is understanding where and how funding has been channelled in the past.
The research presented in this article answers that question: where did the grants go in the environmental sector in Canada in 2007? The study, which involved a database of over 2,000 grants from 93 grantmaking organizations, categorized grants by environmental issue, activity type, location, grantmaker type, and recipient type. The grantmakers in the database include organizations as varied as major corporate foundations, private family foundations, government funds, and community foundations. The study targeted data from grantmakers that are known contributors to environmental initiatives in Canada, particularly those included in previous grants studies and members of the Canadian Environmental Grantmakers’ Network.
Collaboration and the Canadian Environmental Grantmakers’ Network
The Canadian Environmental Grantmakers’ Network (CEGN) was conceived in 1995 by a group of foundations that wanted to improve the effectiveness of environmental funding in Canada. The CEGN operated informally for several years, and in 2000 launched a process of organizational development in order to better serve environmental grantmakers through increased and more effective member services. In 2001, the CEGN was incorporated federally as a not-for-profit organization.
The mission of the CEGN is to expand the scope and effectiveness of grantmaking in support of the Canadian environment, by:
• Encouraging linkages between environment and other sectors
• Nurturing more effective grantmaking through information sharing,
access to resources, collaboration and professional development
• Using a convening role to foster learning, collaboration and new solutions
• Providing information on the state of environmental philanthropy in Canada
• Providing networking opportunities for the Members (with each other and with other sectors)
There is a growing acknowledgement that environmental philanthropy needs to break out of the current paradigm which still views environment as separate from other societal sectors and concerns. It is increasingly clear that building linkages to the economic, health and social justice sectors will be essential to the resolution of many of the environmental concerns with which the environmental community is engaged. Making these linkages is essential to forging new and more powerful partnerships capable of arriving at comprehensive solutions.
One of the CEGN’s strategic goals is to increase overall environmental giving in Canada. However, there are currently few reliable tools for determining the scope and effectiveness of environmental grantmaking in Canada. The environmental grants database, the results of which are reported in this document, provide a benchmark in order to gauge the effectiveness of the CEGN’s efforts. In this way, the research presented in this report can also provide a benchmark for all organizations to gauge their ongoing efforts in the environment.
The data from this research can also be an effective collaborative tool for both grantmakers and grantseekers. The online database, available at http://www.cegn.org/English/grantmaking/dbsearch_public.cfm, enables users to search grants by environmental issue, region and year. This publically available tool facilitates a certain degree of information sharing, and increases the awareness of environmental charities of the funding directions of grantmaking organizations. The CEGN also maintains a private online search site for its members, which facilitates detailed information sharing between environmental grantmakers to ultimately enable the more effective and strategic use of funds and resources. The grants database also highlights environmental giving in other sectors, which enables increased cross-sectoral collaboration. It is the ultimate goal of the database to reach as many environmental practitioners as possible, as this is an important step in increasing their collaborative potential.
History of the grants database
This research on environmental grants is unique within Canada, and addresses an information gap that has only begun to be examined in the past decade. In 2001, the Canadian Environmental Grantmakers’ Network initiated the first study of this kind, examining 1,464 grants from 51 grantmakers. This study was followed up in 2002, and included over 2,700 grants from 90 grantmakers. Since the launch of the original 2001 grants database, regular environmental grantmaking databases have been undertaken by the US Environmental Grantmakers’ Association and the UK Environmental Funders’ Network. The comprehensive grants studies published by these organizations are an excellent source of information on environmental philanthropy in the U.S. and the U.K. and provide important context for the Canadian sector. While a comparison with these countries was beyond the scope of this research project, it remains an interesting area for further analysis and research.
The data from this research can also be an effective collaborative tool for grantmakers. The database is available online in a searchable format at: http://www.cegn.org/English/ grantmaking/dbintro.html#search. The searchable database enables both grantmakers and grantseekers to learn of environmental issues that have been funded in their region.
Method
The 2007 grants study was conducted with the same methodological framework as the previous grants studies conducted by the Canadian Environmental Grantmakers’ Network. To obtain grants data, known grantmakers were contacted through both direct (phone calls, emails, surveys) and indirect (websites, published materials) means. Grants data was subsequently interpreted by researchers and inputted into database software. The categorization for all versions of the database remained the same, enabling, to a certain extent, comparison between the 2002 and 2007 studies. It was determined that grants data that required little or no interpretation, such as location, recipient type, grantmaker type, and environmental issue, could be accurately compared against grants data from the same grantmakers in both years. In the cases where comparisons are shown between 2002 and 2007, the data was thus modified to include only those grantmakers included in both studies. The 2002 and 2007 studies had 50 grantmakers in common, or nearly 55% of grantmakers.
The 2007 update represents a look at 93 grantmakers only and is not a comprehensive overview of environmental grantmakers. While a dedicated attempt was made to include all major contributors to environmental grants in Canada, the unavailability of data and time constraints limited the scope of attainable data. Furthermore, as there remains no ready source of information in Canada reporting on all philanthropic contributions by sector, it was difficult to ascertain the total number of potential grantmakers to have been included in the study. At best, the broad research undertaken by Imagine Canada, Philanthropic Foundations of Canada (PFC), and Community Foundations of Canada (CFC) provides a glimpse into the total number of environmental grantmakers and grants in Canada. These are their survey results from recent years:
• Imagine Canada found in a 2009 survey that 6%, or 468 of 7853 grantmakers,
were self-reporting as having a funding interest in the “Environment” in 2009.
• Philanthropic Foundations of Canada (PFC), a membership organization for independent Canadian funders, found in a 2008 survey of their 96 members that 15% of grants were allocated to the environmental sector.
• Community Foundations of Canada (CFC) found in a 2008 survey that environment accounted for 12% of grants made by community foundations, or $19.8 million of $165 million allocated.
According to these studies, the range of environmental grantmaking in Canada in the years 2008-2009 was between 6% and 15% for the organizations surveyed. This gives some context for the CEGN database report, which likely captured a fair portion, but certainly not all, environmental grantmaking activity. More than anything, this points to an information gap, and a potential area for further philanthropic research in Canada.
Results
The total sum of environmental grant dollars included in this study was $110,565,704. Individual grant amounts varied greatly, from just $51 to over $6,756,681. The average grant size was $50,371, while the median grant size was $14,700.
In 2007, 1,066 different recipients received grants from the 93 grantmakers included in the study. Just over half, 55%, of these recipients were categorized as “environmental” organizations, while the rest were categorized as “non-environmental” organizations (e.g. schools, municipalities, religious organizations) undertaking environmental initiatives.
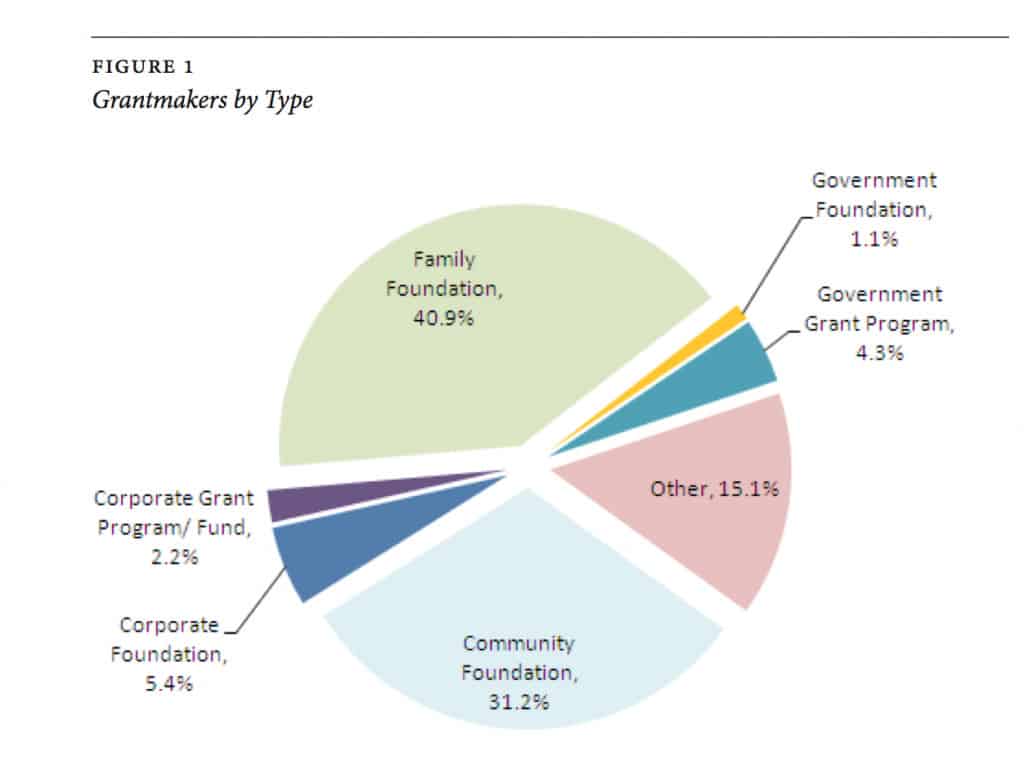
Grantmakers by type
The breakdown of grantmakers by type is shown in Figure 1. The types of grantmakers in the study were classified as: Family Foundation (40.9%), Community Foundation (31.2%), Other (15.1%), Corporate Foundation (5.4%), and Government Grant Program (4.3%), Corporate Grant Program/ Fund (2.2%), and Government Foundation (1.1%).
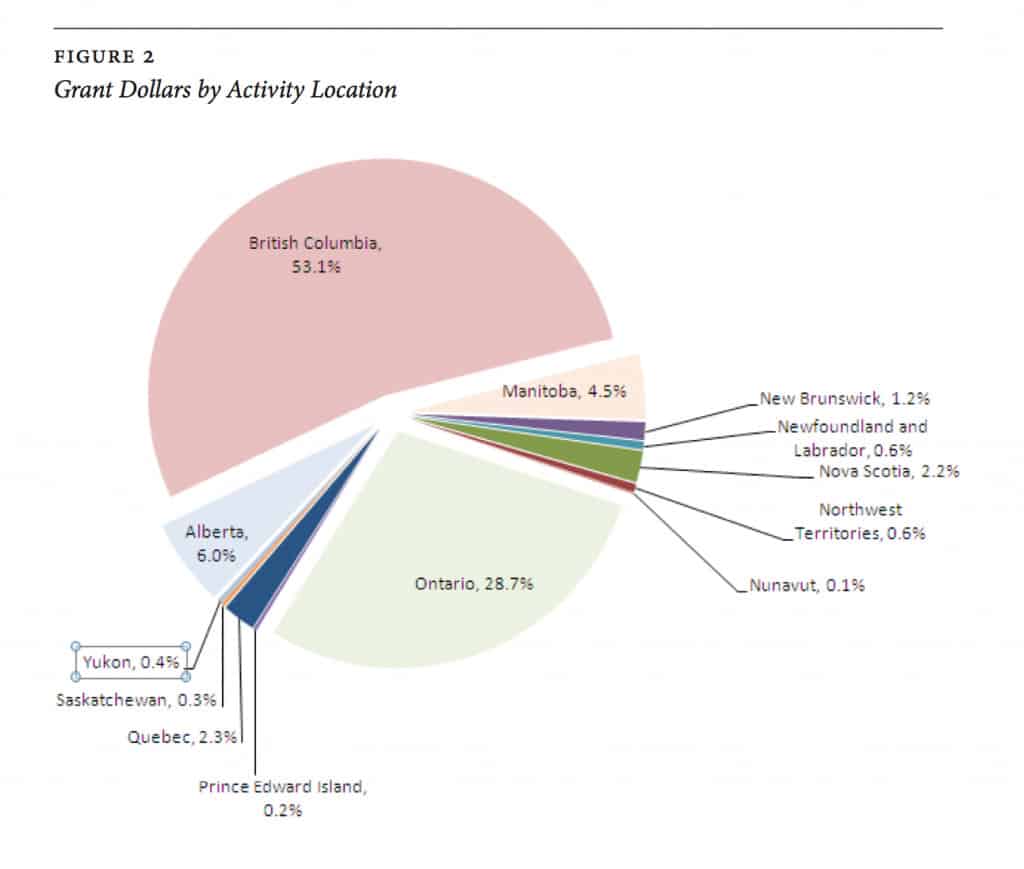
Grants by location
The database tracked grants both according to the location of the recipient and the actual location of the environmental work being undertaken. Figure 2 shows the amount of grants awarded by the location of granting activity.
The location of environmental grants included in the study varied significantly provincially. Activities in British Columbia received over half of all grant dollars in Canada, Ontario received almost one third, while activities in Alberta and Manitoba received 6% and 4.5% of grant dollars. The remaining provinces received comparatively small amounts of grants for environmental activities; Quebec received only 2.3% of funding, Saskatchewan 0.3%, the Northern region (Yukon, Nunavut, and the Northwest Territories) collectively received only 1.1% of funding, while the Atlantic region (Prince Edward Island, New Brunswick, Newfoundland and Labrador, and Nova Scotia) collectively received only 4.2% of funding for environmental activities.
Grants by location and Canadian population
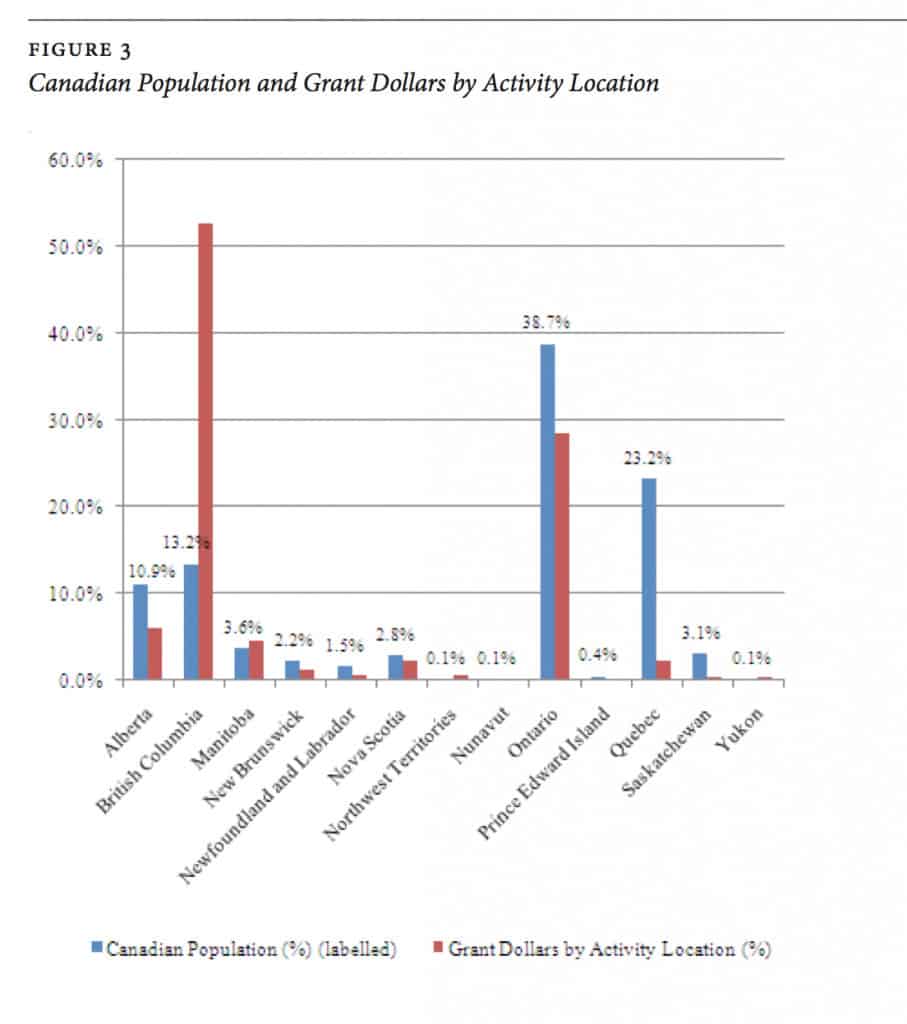
The distribution of grants by environmental activity location against Canadian population figures is shown in Figure 3. This comparison gives a sense of how population distribution compares with the geographical distribution of environmental initiatives.
Environmental initiatives in British Columbia, with 13% of the population, received 53% of grant dollars. Ontario initiatives received 29% of grant dollars, with almost 40% of the country’s population. Quebec, with almost one quarter of the country’s population, received only 2.3% of funding for environmental initiatives. The Prairie provinces (Alber—ta, Saskatchewan, and Manitoba) collectively received 11% of grant dollars, with 18% of the population. The Atlantic region (Prince Edward Island, New Brunswick, Newfoundland and Labrador, and Nova Scotia) accounts for 6.9% of the population and received 4.2% of funding. The Northern region accounts for 0.3% of the population and received 1.1% of funding.
Grantmakers by location
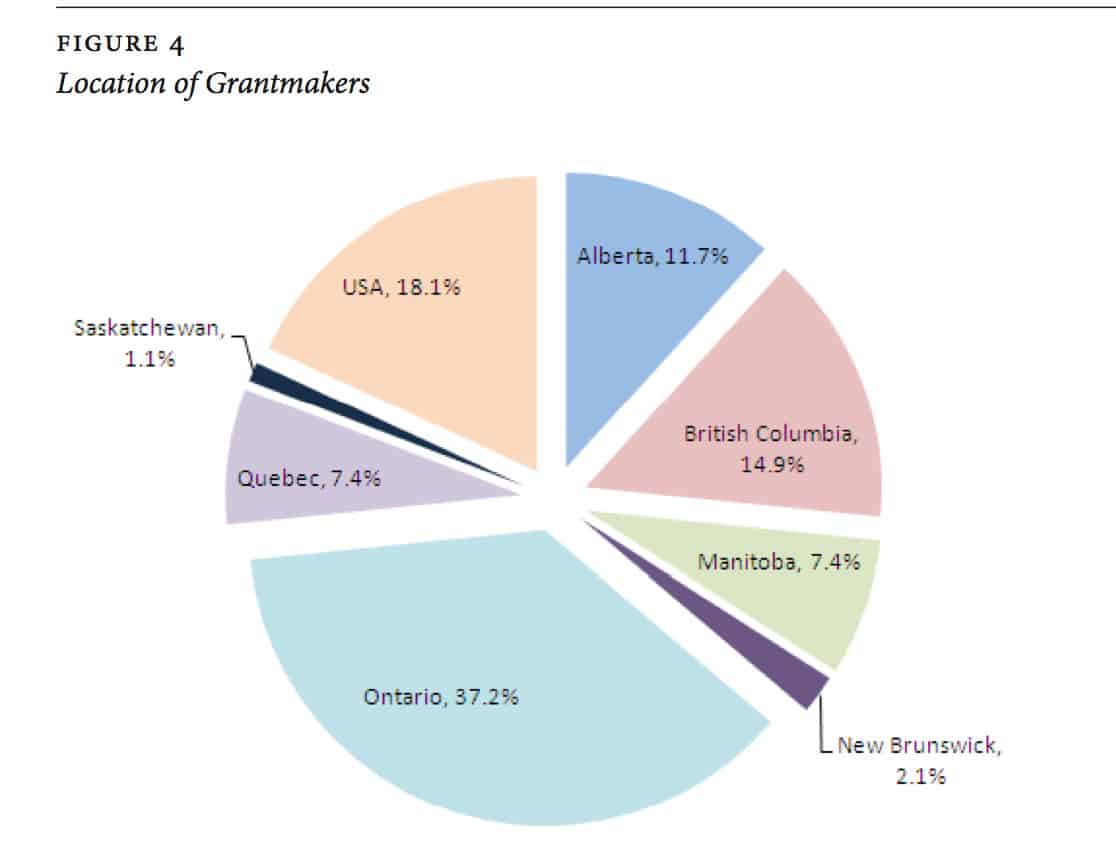
The location of the grantmakers, by head office, included in this study is shown in Figure 4.
As the chart shows, a large percentage of grantmakers in the study are located in Ontario, representing 37% of all grantmakers. Nearly one-fifth (18%) of grantmakers in the study are located in the U.S., indicating a high level of support for environmental initiatives in Canada from American grantmakers. Nearly 15% of grantmakers are located in British Columbia, with 12% in Alberta, 7% in Manitoba, 2% in New Brunswick, and 1% in Saskatchewan. There were no grantmakers in the study with head offices in Newfoundland and Labrador, Nova Scotia, Prince Edward Island, Nunavut, Yukon or the Northwest Territories.
Grantmakers by location and grant dollars (by recipient location)
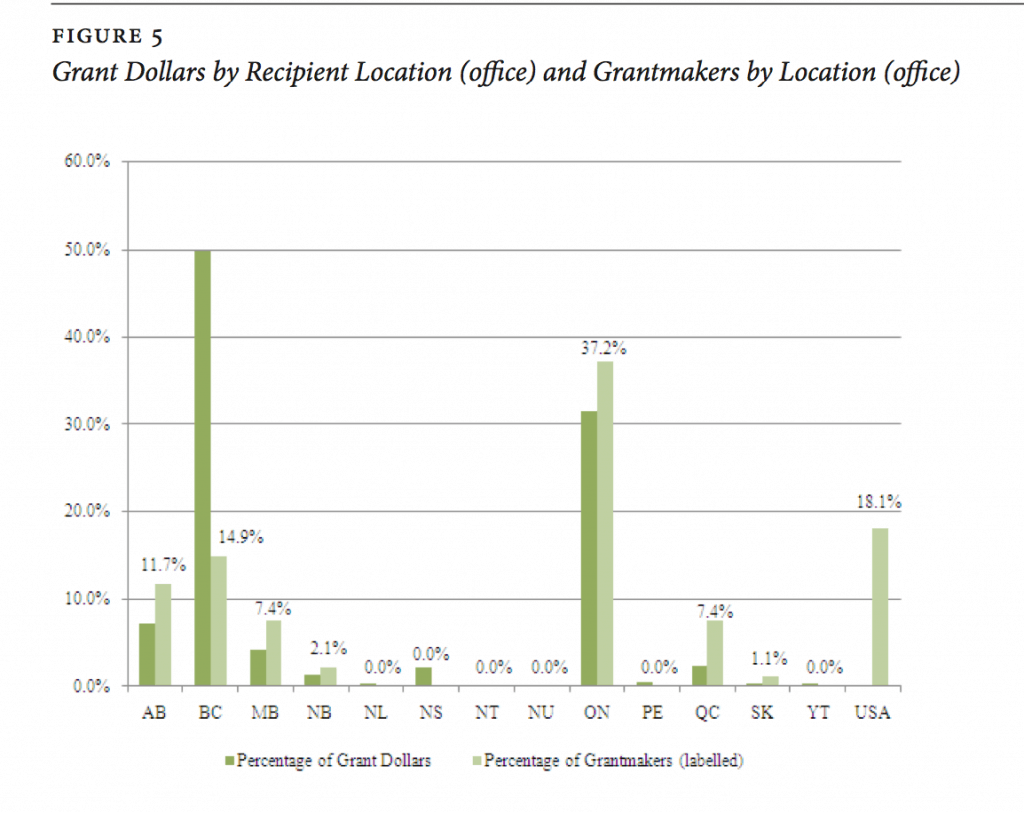
The geographical distribution of grantmakers raises the question of the relationship between the location of grantmakers and the distribution of grants. In Figure 5, the distribution of grants is shown alongside the location of grantmakers.
Only British Columbia (receiving 49.8% of grants to 14.9% of grantmakers), the Atlantic provinces (receiving 4.4% of grants to 2.1% of grantmakers) and the Northern territories (receiving 0.3% of grants to 0% of grantmakers) had proportionally more grants than grantmakers in their regions. Alberta received 7.1% of grants to 11.7% grantmakers, Manitoba received 4.2% of grants to 7.4% of grantmakers, Quebec received 2.3% of grants to 7.4% of grantmakers, and Saskatchewan received 0.4% of grants to 1.1% of grantmakers. Ontario received almost one third of grants with 37.2% of grantmakers.
Grants by issue
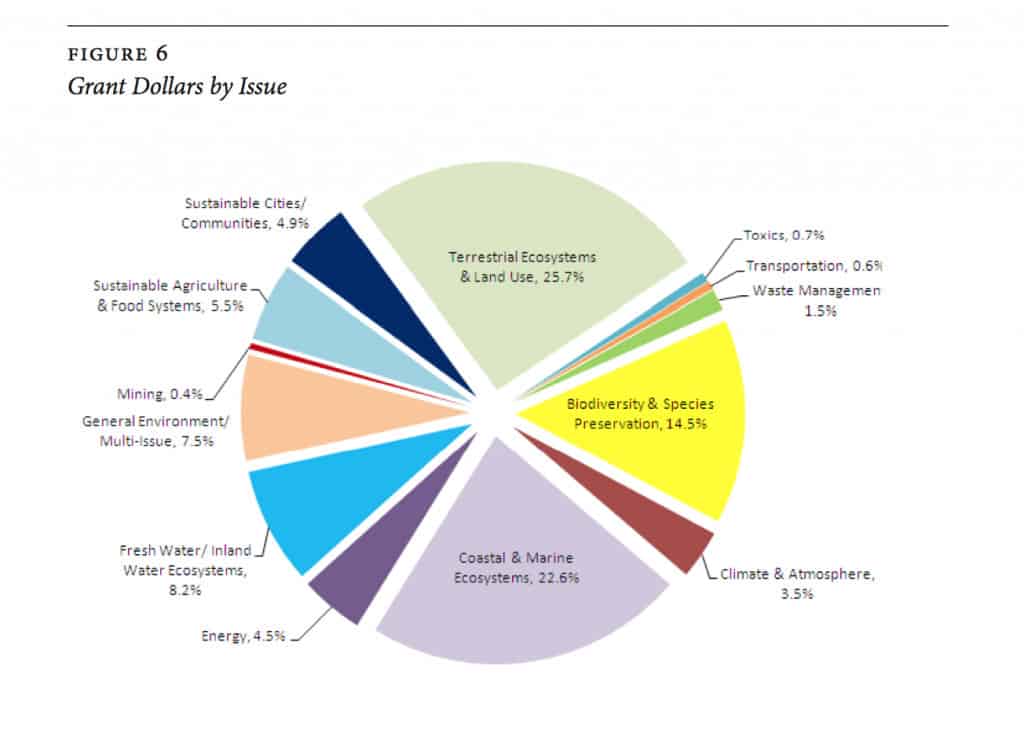
The grants were categorized into 13 broad environmental issues, in order to get a sense of the types of environmental initiatives receiving funding. The breakdown of funding by issue area is shown in Figure 6. Issues relating to Biodiversity & Species Preservation received 14.5% of grants, Terrestrial Ecosystems & Land Use 25.7%, Coastal & Marine Ecosystems 22.6%, General Environment/Multi-Issue 7.5%, Sustainable Agriculture & Food Systems 5.5%, Sustainable Cities/Communities 4.9%, Climate & Atmosphere 3.5%, Fresh Water/ Inland Water Ecosystems 8.2%, Mining 0.4%, Toxics 0.7%, Transportation 0.6%, Waste Management 1.5%, and Energy 4.5%.
Environmental initiatives were categorized into more than one “issue” in order to capture the multi-faceted nature of environmental projects. For example, a river clean-up project aimed at increasing levels of endangered fish populations would be categorized as both Fresh Water/Inland Water Ecosystems and Biodiversity & Species Prevention. Likewise, a project that supported policy change for renewable energy would be categorized as both Energy and Climate & Atmosphere.
Grants by issue—changes since 2002
Since the datasets in 2002 and 2007 contain different grantmakers, the data needed to be adjusted in order to generate accurate comparisons in the issue category. The adjusted data maintained grantmakers that were the same in 2002 and 2007, grantmakers that were new since 2002, and grantmakers that became non-operational after 2002. U.S. grantmakers that made grants in Canada in 2002 but not 2007 (and vice-versa) were also maintained. Omitted grantmakers were those that existed in 2002 but were only included in the 2007 study, and vice-versa, as their inclusion in the comparison would not reflect a change in the grantmaking scene but rather changes in the availability of data.
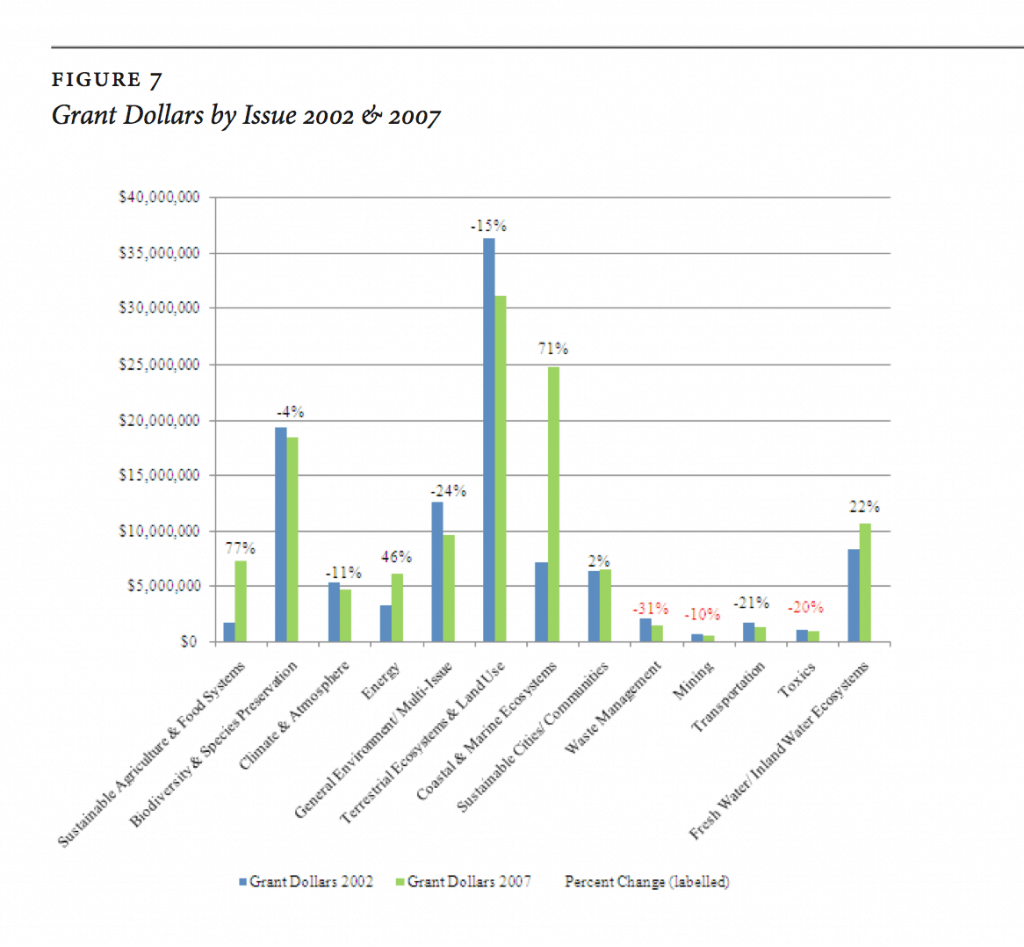
As shown in Figure 7, the environmental issues that received more support in 2007 than 2002 were: Sustainable Agriculture & Food Systems (receiving 77% more grants in 2007), Energy (receiving 46% more grants in 2007), Coastal & Marine Ecosystems (receiving 71% more grants in 2007), Sustainable Cities/Communities (receiving 2% more grants in 2007), and Fresh Water/Inland Water Ecosystems (receiving 22% more grants in 2007). The environmental issues that received less support were: Biodiversity & Species Preservation (receiving 4% less grants in 2007), Climate & Atmosphere (receiving 11% less grants in 2007), General Environment/ Multi-Issue (receiving 24% less grants in 2007), Terrestrial Ecosystems & Land Use (receiving 15% less grants in 2007), Waste Management (receiving 31% less grants in 2007), Mining (receiving 10% less grants in 2007), Transportation (receiving 21% less grants in 2007), and Toxics (receiving 20% less grants in 2007).
Generally, issues relating to ecosystems and species tend to predominate in environmental funding, receiving 69% of funding in 2002 and 71% in 2007. Coastal & Marine Ecosystems and Sustainable Agriculture & Food Systems showed the most change, increasing in funding by nearly three quarters between 2002 and 2007.
Grants by keyword
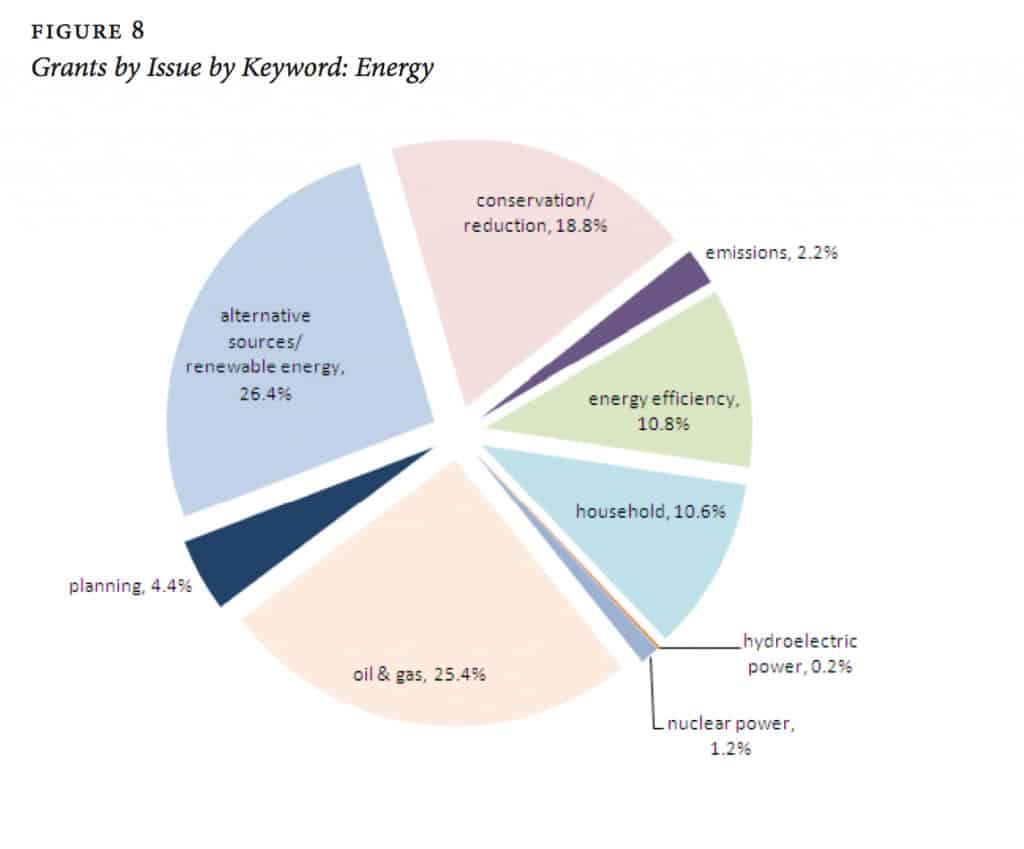
Grants in the database were assigned keywords related to their environmental issue. Figure 8 shows the breakdown of keywords by the environmental issue of Energy in 2007.
Keyword breakdown show where within each environmental issue funding is typically emphasized. The most energy funding, accounting for over 70% of funding, went toward alternative sources/renewable energy (26.4%), oil & gas (25.4%), and conservation/ reduction (18.8%). Energy efficiency accounted for 10.8%, household 10.6%, emissions 2.2%, hydroelectric power 0.2%, nuclear power 1.2% and planning 4.4%.
Keywords are useful for this study as they enable comparisons on specific initiatives between years and between regions. For instance, the difference in funding for alternative sources/ renewable energy can be compared between 2002 and 2007 or it can be compared between Ontario and British Columbia. In 2002, alternative sources/renewable energy accounted for 21.9% of energy funding, and 0.1% of total funding, and in 2007 accounted for 26.4% of energy funding, and 2.3% of total funding. Alternative sourcesrenewable energy accounted for 5.3% of funding in Ontario in 2007, and 1.1% of funding in Alberta in 2007.
In order to capture the changes in the types of environmental issues being funded, a number of new keywords were added to the database. These new keywords reflect a number of factors, including changes in grantmaking focus, and the emergence of new terminology.
The new keywords were: climate change adaptation, local food, wildlife—microfauna/ insects, nutrient management [manure], energy planning, pests—insects/biological, bogs/swamps/marshes, green buildings/infrastructure—LEED, storage [water], forest– FSC [Forest Stewardship Council], environmental stewardship, hazardous waste, networking/collaboration, health/ exposure [toxics], waste diversion—compost [organics], children & youth—camps, agro-tourism, history, distribution [food], media.
Grants by activity
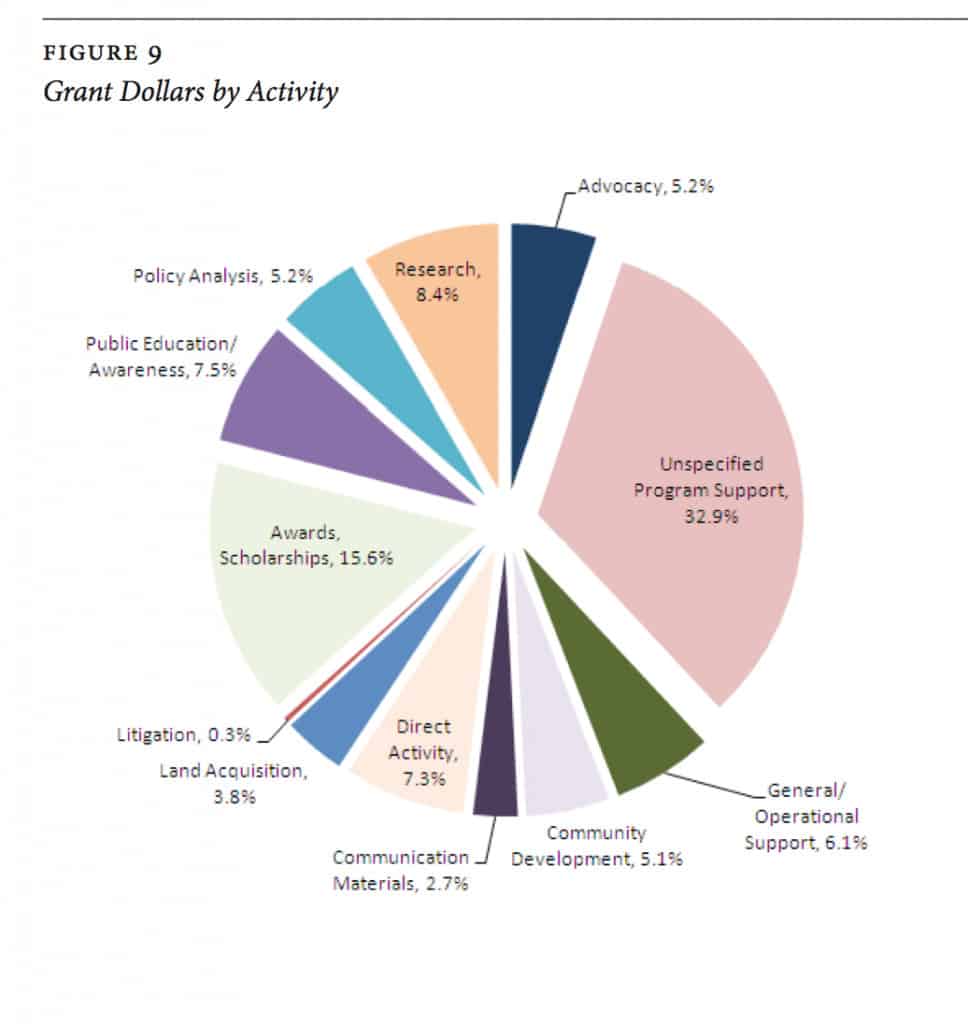
Each grant in the database was categorized by a specific activity type, as shown in Figure 9.
Unlike keywords and issues, each grant could only be categorized as one type of activity. Funding for Advocacy received 5.2% of grant dollars, Unspecified Program Support 32.9%, Research 8.4%, Policy Analysis 5.2%, Public Education/Awareness 7.5%, Awards/ Scholarships 15.6%, Litigation 0.3%, Land Acquisition 3.8%, Direct Activity 7.3%, Communication Materials 2.7%, Community Development 5.1%, General/Operational Support 6.1%.
Specifying a grant’s “activity” required a significant degree of interpretation on the part of the researcher, particularly for activities such as Unspecified Program Support, Direct Activity, and Advocacy. For this reason it was determined that comparing activities funded with 2002 data, which was interpreted by a different set of researchers, would not provide a reliable estimation of the change between the activities.
Discussio n
The data raises a number of interesting questions about the nature of grantmaking in Canada.
Grants by location
In Figure 3, it was shown that there were significant disparities in most cases between population levels and the amount of grants awarded in each province. While it is not necessarily assumed that the distribution of grants should match the population distribution, it does raise questions as to what factors do influence the location of environmental activities. For example, are there more environmental concerns in British Columbia, which receives almost half of all environmental grants dollars? And how are U.S. dollars broken down geographically—do they tend to go to provinces with the most cross-border environmental issues?
Grantmakers by location
In Figure 5, the location of grantmakers’ head offices was compared with the location of recipients’ offices. The comparison between these figures raises the question of whether grantmakers tend to fund initiatives within their home provinces. As many grantmakers have overt mandates to fund within their home province (particularly community foundations and lottery trusts), a match between grantmaker location and environmental activity location can be anticipated. The significance of this for provinces that house few grantmaking organizations is that they tend to receive a smaller proportion of funding. What does this mean for environmental issues outside of the more populous provinces, particularly northern Canada, Atlantic Canada, and Saskatchewan?
Grants by issue
In Figure 6, the breakdown of funding of environmental issues was examined. The overwhelming majority (nearly 75%) of grants went toward initiatives relating to the ‘terrestrial’ environment, such as biodiversity & species preservation, coastal & marine ecosystems, and terrestrial ecosystems & land use. This raises a number of interesting questions: Is this how funders generally conceive of environmental issues? Or did the study itself imply a certain type of environmentalism by definition? The small amount (3.5%) of funding allocated to Climate & Atmosphere, despite the heightened awareness of this issue in the past decade, also raises the question of whether some very important environmental concerns are not receiving commensurate attention.
Grants by activity
In Figure 9, the breakdown of funding by organizational activity was examined. The highest percentage of funding went towards Unspecified Program Support activities in 2007. With the exceptions of Unspecified Program Support, Litigation, and Awards/ Scholarships, the data showed a fairly even spread across all types of environmental activity. Unspecified Program Support was defined as expansion or development of a specific program or project within an organization, either by means of increasing capacity (such as hiring new staff, expanding the volunteer base, staff training), or in an unspecified way. Funding that was not directed toward a specific program or project, but was intended for the operational costs in an organization, was defined as General/ Operational Support.
Conclusion
The main thrust of this research project was to answer the question: where did the grants go in the environmental sector in Canada in 2007? While this study was not comprehensive—not all grantmakers that gave in the environment in 2007 were included—it does give a sense of where and how environmental funding was channelled in Canada. And it is the intent of this research to give grantmakers a sense of how their funding contribution fits into the broader picture of grantmaking in the environmental sector. For some organizations, it may serve as affirmation that their organization’s funds are being channelled wisely, while other organizations may use this data to re-direct funds into issues and activities which they were previously not previously supporting.
The environmental grants database has significant potential as both a collaborative tool and for generating further data about environmental granting in Canada. Potential areas of further research could be:
• Comparisons with data produced by the U.S. Environmental Grantmakers’ Association and the U.K. Environmental Funders’ Network
• Analyses of environmental granting by region in Canada
• Comparisons between funding for specific “keywords” by year
• Cross-comparisons between environmental issues and regions
The online component of this database is also an important tool for collaborative work between grantmakers. The searchable database enables grantmakers and grantseekers to search for funders by environmental issue area, which can be valuable for organizations in identifying potential partnerships. Members of the Canadian Environmental Grantmakers’ Network have online access to additional information about environmental grants, including information about previous partnerships between grantmakers and grantees on environmental projects. The purpose of this online tool is to facilitate information sharing about best practices for environmental projects, as well as create opportunities for further collaboration between grantmakers.
References
Canadian Environmental Grantmakers’ Network. (2001). A profile of environmental grantmaking in Canada: 2001 National Overview. Toronto, ON.
URL: http://www.cegn.org/English/grantmaking/documents/2001_Nat_Overview.pdf
Canadian Environmental Grantmakers’ Network. (2002). A profile of environmental grantmaking in Canada: 2002 National Overview. Toronto, ON.
URL: http://www.cegn.org/English/grantmaking/documents/2002%20National%20
Overview.pdf .
Community Foundations of Canada. (2008). Annual report 2008. Ottawa, ON.
URL: http://www.communityfoundationsofcanada.ca/documents/2008/annualreport-cfc-2008.pdf .
Cracknell, Jon, Godwin, Heather, Williams, Harriet. (2009, November). Where
the green grants went 4: Patterns of UK funding for environmental and conservation work. Environmental Funders’ Network, UK.
URL: http://www.greenfunders.org/resources .
Environmental Grantmakers’ Association. (2009). Tracking the field: A closer look at environmental grantmaking. New York, NY.
URL: http://www.ega.org/news/docs/SummaryFinalDec2k9.pdf .
Imagine Canada. (September 2009). Funding Interests of Foundations in the Canadian Directory of Foundations and Corporations. Toronto, ON: Personal Communication. Philanthropic Foundations Canada. (2008). Building solid foundations: 2008
annual report. Montreal, QC.
URL: http://pfc.ca/en/wpcontent/uploads/files/annual%20reports/ar_2008.pdf .
Terris Lutter is a researcher for the Canadian Environmental Grantmaker’s Network, 215 Spadina Avenue, Suite 360, Toronto, on m5t 2c7.
Email: info@cegn.org .