Introduction
Most foundations and endowments regard themselves as perpetuities although some, such as The R. Samuel McLaughlin Foundation, have a planned termination date. All others presumably wish to maintain the value of their assets despite inflation and to continue their charitable grants on an equivalent or growing scale in real dollars.
To achieve those goals it is well to remember that investment income and capital gains are just as important as endowments and donations. Returns on the assets in the foundation or charity, and the risks taken to achieve those returns, do matter.
This being so, anyone responsible for the investment of foundation or endowment assets needs continually to ask, “Are the investments appropriate for the purpose?” and “How good is the performance?” The first question deals with investment strategy and policy. The investment committee should be concerned with longer-term strategy and policies and be clear that the investment manager agrees with and understands them. The investment manager, in turn, should be concerned with the implementation of short-term policies consistent with the long-term strategy and is responsible for explaining these adequately to the investment committee.
The second question, “How good is the performance?” must be examined in two parts: the returns and the risk levels. These are ofinterest to both parties but are the responsibility of the investment committee or its equivalent since management of any process requires review and measurement.
Those responsible for the welfare of an endowment or foundation fund may find different ways to assess success but all of them will involve some form of comparison and measurement. This comparison and measurement may involve nothing more complicated than periodically determining the market value of the investments, selecting established market indices, and comparing the foundation’s results with them. (Since both rising and falling markets should be included, four-year periods have become normal for performance measurement and the relative overall risk level of the foundation’s investments also should be measured.)
. ———
Objectives
Before you answer questions about performance, you must decide where it is that you want to go. That is, you must establish and understand your objectives before you know what it is that you need to measure.
Even a very simple, but clear, statement of objectives can be effective for the purpose. For example, The Winnipeg Foundation has operated effectively by stating its investment objectives to be “”to attempt to maintain the capital value and thus the purchasing power of the fund while providing an appropriate cash flow of income for grant-making purposes”. In other words, like most foundations, The Winnipeg Foundation wishes to provide a perpetual flow of money for its charitable activities at some rate in excess of inflation. Investment objectives must be written down and there must be agreement between the investment committee and the investment manager as to the objectives, strategies and general policies he or she will be expected to follow.
Performance Comparisons
It would be valuable for Canadian foundations to measure their investment performance against that of other Canadian foundations but this is difficult because so few foundations have arranged for external performance measurement. As an alternative, some foundations have turned to comparable information available for mutual funds or pension funds.
However, foundations are significantly different from mutual funds and pension funds both in their objectives and their cash flows. For one thing, foundations certainly cannot count on a continuous inflow of funds. Therefore, comparisons with other kinds of funds are suspect and have distinct limitations. Although the investment managers for foundations, like other professional fund managers, want a growing total of assets to manage (and correspondingly higher fees), they are necessarily limited by the legal requirement to distribute funds and the directors’ desire to be generous.
Unlike mutual and pension funds, foundations which are registered charities are subject to a minimum disbursement requirement underthelncome Tax Act and Regulations. To retain their charitable status foundations must expend annually on charitable activity an amount which is equivalent to 4.5 per cent of the average value of their investment assets1 • This is clearly a restraint, although more significant for some than for others.
Income v. Capital Gains
At the present time (Summer 1988), the dividend yield on the Toronto Stock Exchange 300 Composite Stock Index is 3.04 percent. At that level a foundation with its investments exclusively in equities is clearly going to lack sufficient income to make the necessary disbursements, i.e., unless the value of the capital is increasing sufficiently to make up the difference, the investment performance has not achieved the foundation’s objective. If, on the other hand,
the increase in capital value is more than adequate then, expressed in terms of total return, the objective has been well met.
For the purpose of compliance with the Income Tax Act, it is immaterial whether the money disbursed happens to be tagged by the accountant as “income” or as “capital gain”2• Once the money has been received, they are equivalent; both represent a return on investment.
No one would buy equities with the current yield of three percentiftherewere not an expectation of some other return, i.e., capital gain. Thus the foundation objective of remaining a perpetuity is still met if capital gains are used to meet the 4.5-per-cent requirement.
Criteria To Be Measured
Comparing an apple with an orange is little help in deciding whether the apple is developing as it should. The selection of the basis for comparison of investment performance is therefore critical.
For foundations, the total return, including both income and capital gain or loss, should be measured. (In fact, the Securities and Exchange Commission in the United States requires this for mutual fund reports.) For that reason, in this report all returns are total returns, including both capital gains and income.
Your comparisons, to be meaningful, must also take into account the fact that a dollar in the hands of the foundation today does not have the same value as a dollar 10years, or even one year, ago. This is not a new idea. Half a century ago, Irving Fisher pointed out that interest rates are composed of a “real”part and a provision for inflation (or expected inflation).
Accordingly, in this report, the returns quoted are not only total returns, including both income and capital gain, but are also adjusted for inflation, as measured by the Consumer Price Index.3 Alternative approaches to adjusting for inflation exist but adjustment using the C.P.I. is the one most commonly used.
Investing In The Real World
Most investors dream of buying near the bottom of the market cycle and selling near the peak; however, according to at least one recent theoretical study4, it is not possible to achieve this sort of fine-tuned timing. Only 16 of75 Canadian mutual funds (21 per cent) have outperformed the Toronto Stock Exchange 300 Index over the last 10 years (after management fees and expenses have been deducted), and the few real successes, in some cases at least, could be due to the selection of stocks rather than timing. In any case, virtually no one consistently outperforms the market each year over any 10-year period.
The timing of increases and decreases in the median commitment of pension funds to the stock market has been clearly perverse in the last decade at least.
—– .— –
The levels of cash and short-term securities held by mutual funds in that period have been so incorrect that such levels are now used as indicators of what not to do. (The logic behind this is that if the mutual funds, a large segment of the market, have an unusually large amount of cash and short-term investments, then there will be an extra amount available for investment in the market at some future date. Since any group of funds, e.g., mutual funds, is a majorcomponentof the market, any surges by them in oroutof the market will push market prices against them.)
Another guide that is often used is the Investment Advisory Services Index. Whenever the investment advisory services are predominantly bullish, it has usually been a good time to sell equities, and vice versa. Unfortunately, this is not an infallible guide either.
Many people feel it should at least be easy to predict interest rates. Sorry. The Toronto Society of Financial Analysts (the third largest on the continent) organizes a Forecast Dinner each September. A thousand people attended last fall. One of the four forecasts each year is for bonds. These forecasts are beautifully reasoned and developed, logical and well presented. Unfortunately, six of the last eight have been wrong, not only as to amount, but as to the direction of change in interest rates.
Is there reason, then, to expect that foundations and endowments will be managed much better than mutual funds or pension funds except in individual cases? Reviewing the above facts the answer must be “no”: a stable, or relatively stable, allocation of funds among various classes of investment must be recommended.
Risk
Virtually all investors want a high total return, preferably in a reasonably even flow, with low risk. However, since the dawn of investment history, it has been “known” that such a higher return is typically associated with a higher risk. Yet, as we shall see, this is not necessarily the case. (Remember this point, it is one of the most important conclusions of this report. There is, after all. no point in accepting a lower return if you do not enjoy lower risk!)
The factor of risk is one to which a foundation should be particularly sensitive so the determination of risk is an essentialingredient in selecting foundation investments.
There are five categories of risk:
(a) Market value risk. This is the most obvious, and typically the most important consideration. (The difference between diversifiable and undiversifiable risk cannot be covered here.)
(b) Default risk.
(c) Interest-rate risk. Investors have learned a lot about this in the 1980s.(d) Liquidity and marketability risk. Will you be able to sell your holding without undue pressure on the market price?
(e) Purchasing power risk. Will inflation wipe out your nominal return?
Overall. risk can reasonably be related to volatility, except for default risk, liquidity risk and purchasing power risk, which can be considered separately. Default risk, by definition, does not apply to stocks, because equities do not come with written guarantees. There have been relatively few defaults on bonds in recent decades, but this is not true of mortgages, particularly in suddenly depressed areas such as Alberta. You need to be aware of your liquidity risk level but that is not properly a subject for this paper. Consideration of the purchasing power risk will be handled by using only data adjusted for inflation.
Volatility can be measured, and it has become the usual definition of risk. Returns tend to be symmetrical about the average, so pleasant outcomes may reasonably be included with unpleasant outcomes in determining a definition of risk. (In case you care, a recent study5 concluded that “beta” is less satisfactory as a measure of the volatility of a portfolio than is the standard deviation.)
Obviously all investors are risk-averse to some extent. No one likes to see his or her investments decline. It hurts. On a more serious level, a decline in the value of foundation investments may lead to the necessity for reducing charitable grants. That hurts too. “Optimum” portfolios are those that have the highest return for a given level of risk. Once you have decided your comfort level of risk, you should not accept a lower return than necessary for that level.
Overview Of Historical Record
Our overview will begin with a report on investment performance over the last 64 years, which is, as far as I am aware, as long a period as is covered in any published or unpublished reviewofCanadian total investment returns. (Note that both income and capital gain or loss are taken into account and that, over this lengthy period, this information is available only for long-term bonds and common stocks.) Data for treasury bills and mortgages are available for the past 31 years and information on mid-term bonds can be added for the past eight. These will be dealt with later.
The years since 1923 include periods of prosperity, boom, bust, depression, war, inflation, disinflation and deflation; periods of complete faith in governmental “fine-tuning” and its failure and collapse; periods of fiscal responsibility and then massive deficit and “supply-side” economics (even in prosperous times); the quintupling of oil prices followed by their collapse; periods on the gold standard; managed exchange rates and wild fluctuations in currency levels; the battle by the monetary authorities against inflation in the early 1980s; and virtually any other fiscal climate imaginable.
The past carries no guarantee for the future but you can’t tell where you are going unless you know where you have been and where you are. We must look forward and at the same time use all the knowledge and insight we can muster.
One observation that emerges from a long-term study of investment results is the value of diversification in reducing risk. While one purpose in having some equities in the portfolio has always been, presumably, to enhance the total return, they also can reduce risk! In fact, portfolios diversified between bonds and stocks have been less risky (i.e., less volatile) over time, and also had higher returns, than portfolios invested solely in bonds. Unusually bad returns were avoided more often if some equities were included and portfolios about
40 per cent to 50 per cent invested in stocks had the lowest downside risk over the full 64 years. Using a more recent period such as the last 31 years, statistically the lowest downside risk occurred in a range of from 50 per cent to 60per cent equity investment. (The explanation follows Table I.)
For the measure of variability in the two longer-term studies, the standard deviations6 of annual rates for rolling four-year periods were used to modify swings. This length of time is also the one that many institutional investors have considered significant to catch complete economic cycles.
The 64-Year Record: 1924 to 1987
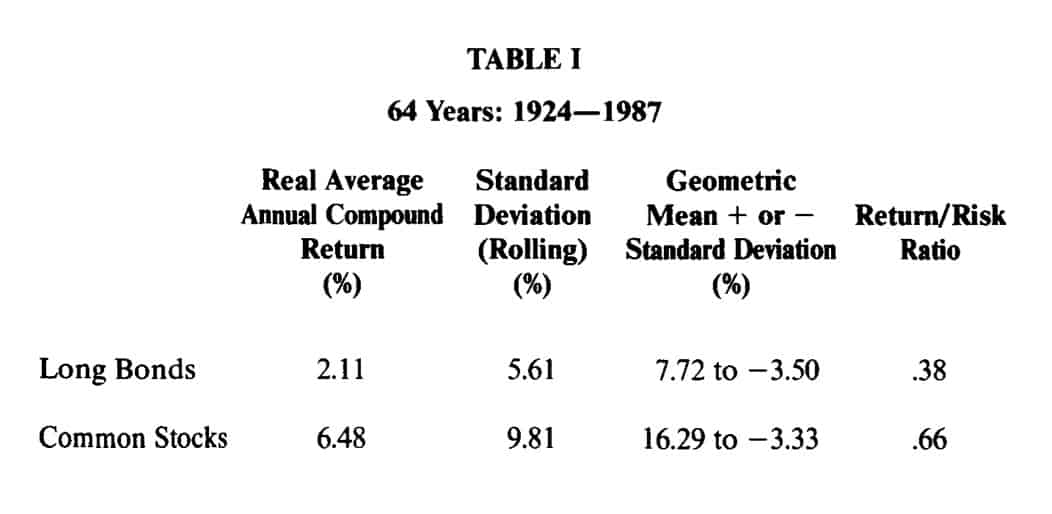
Over almost six and a half decades, the real return on the long bonds7 measured as a 2.11 per cent average annual compound rate after inflation, and the average real return on common stocks8 was 6.48 per cent.
Portfolios with a mixture of these bonds and stocks would have had returns between these two rates. The upper line on Chart I shows the average compound returns if10 percent, 20 percent, etc. of the portfolio had been invested in these common stocks. The lower line shows the average minus one standard deviation.
Readers will be able mentally to project a third line on these graphs showing the average return plus one standard deviation; however, in practice, most investors are less concerned with upside fluctuations. Risk is usually thought of as downside risk.
You may have noticed that the upper line on Chart I is not a straight line. The fact that the return in the more balanced portfolios is more than a proportionate share of a 100 per cent bond portfolio and a 100 per cent stock portfolio is due to “rebalancing” (i.e., returning to the previous percentage breakdown) every year. The fact that the line is not straight proves that there is value in maintaining the portfolio balance. The benefit is fairly sure, but not great.
Table I (see image)
Columns I and 2 in Table I show the average annual compound real return and the standard deviation of the annual rates for rolling four-year periods.
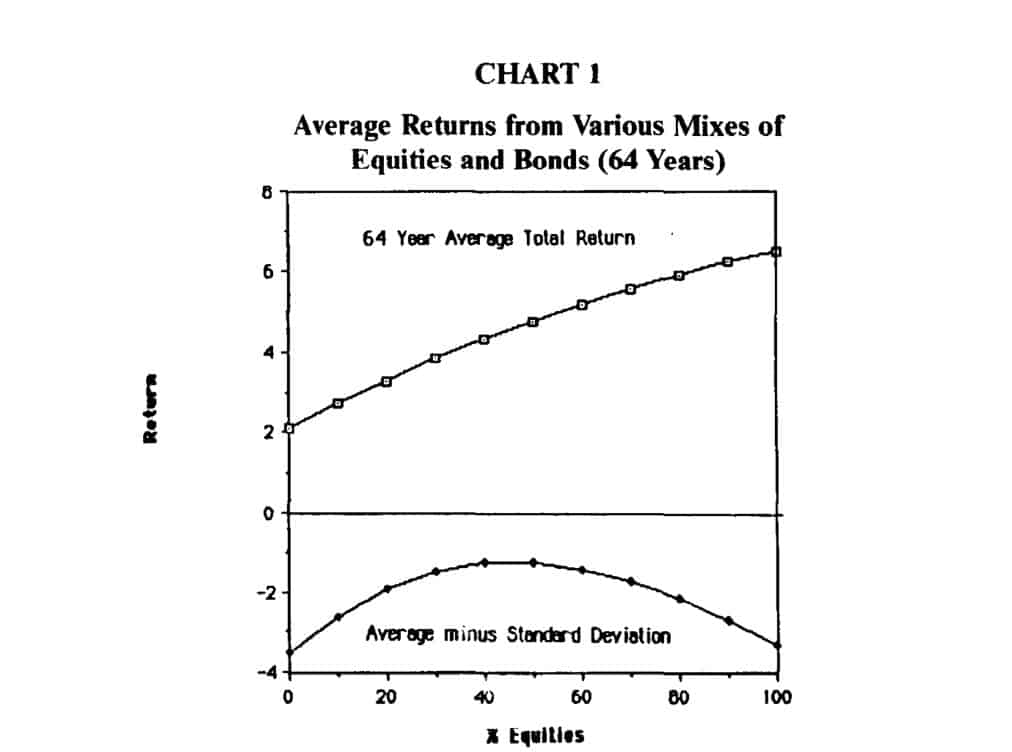
Table I, column 3 shows the range one standard deviation above and below the average. This range was chosen because it typically covers about twothirds (67 per cent) of the results. (“Geometric mean” is identical to the “average annual compound rate”.)
The heading of the final column is a misnomer to some extent but it has the advantage of brevity. It shows the ratio of the average return to the standard deviation (the Sharpe ratio). We do not try to indicate that this is the best way to determine return as against risk; it is merely one calculation—a simple oneaimed at the consideration of reward compared to risk.
TABLE I (see image)
Several interesting points emerge from this mass of data:9
The long-term returns on stocks have been higher than those on bonds except in the 1980s and over some other short periods. Since the crash last October. everyone is aware of the risk involved in investing in stocks but this risk. as measured by fluctuations over the years, has been only of the order of one and a halftimes that for bonds.
The lower line on Chart I shows the average return. minus one standard deviation, for portfolios with various percentages invested in bonds and common stocks. Normally, about 16 per cent of the returns would fall below this lower line. (Remember that we are using four-year rolling periods. The variability, and so the standard deviation, of these is about half of the annual variations in the longer studies.)
The lower line can thus be considered as an indication of the degree of downside risk. You will notice that the risk is much greater if the fund is invested all in bonds or all in stocks than if it is diversified. The least downside risk, according to this measure. occurred over the long period when equities amounted to 40 per cent to 50 per cent of the total portfolio.
Nominal returns before adjustment for inflation show the average compound return on bonds was 5.50 per cent and 9.77 per cent for stocks. The return/risk ratios would change drastically to 1.20 and .96 respectively if before-inflation data were used; in fact. the rank reverses. This is one demonstration of the limited usefulness of this indicator.
The Long Bond Index calculated by ScotiaMcLeod is designed to reflect the “Canadian bond market”. The share of the total value represented by government bonds in this index has risen dramatically from around10 per cent in 1976 to over 60 per cent now! As noted earlier, only information on government bonds is available for years prior to 1948. Currently we seem to be getting closer to a position where bonds issued by governments are almost the only ones available.
The Last 31 Years: 1957 to 1987
The nominal average compound returns before adjustment for inflation were 7.07 per cent for bonds and 9.55 per cent for stocks for this period. The return/ risk ratios would change drastically to 1.25 and 1.40 respectively if beforeinflation data were used.
Chart 2 (for 31 years) may seem broadly similar to the previous one, yet there are differences. Both show real returns on portfolios with various proportions in bonds and common stocks. The return and the volatility of bonds after inflation are roughly similar in each case. However. the real return on the stocks has fallen somewhat. Surprised? The volatility also drops when you exclude the 1920s and the Depression years.
TABLE II (see image)
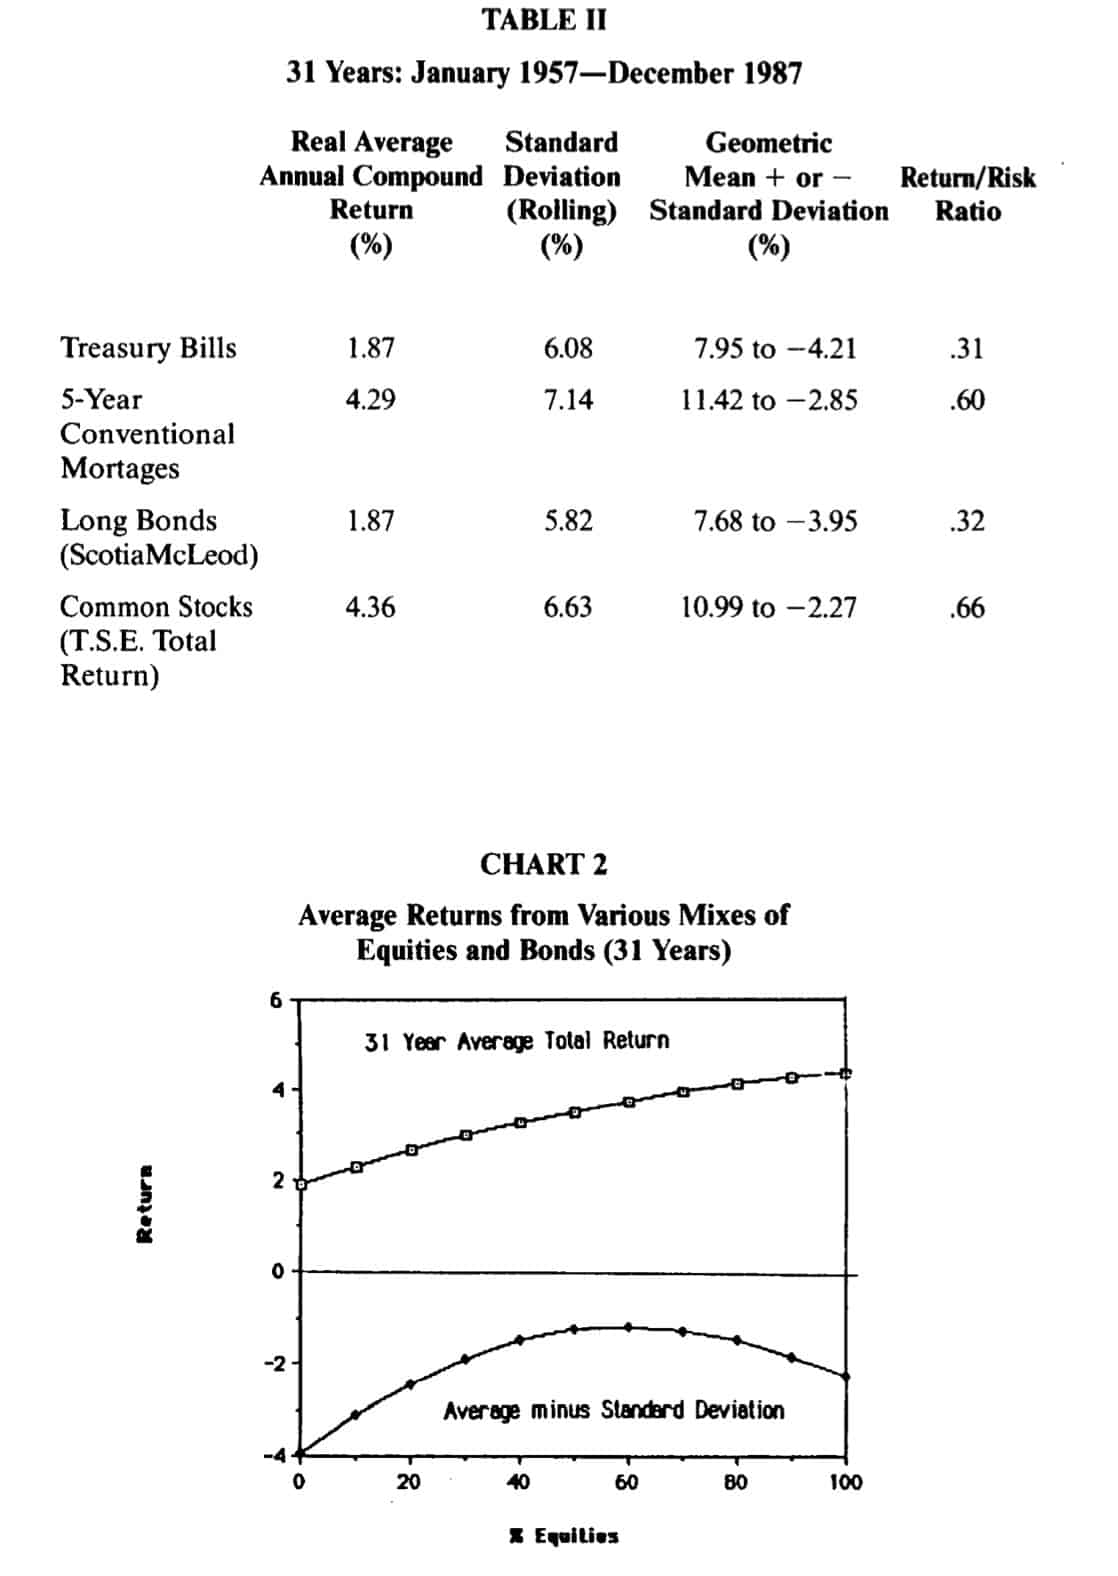
The lower line on Chart 2 peaks with a higher percentage of equities than the earlier chart. The least downside risk over the more recent period resulted when 50 to 60 per cent of the portfolio was in common stocks. However, this evidence is greatly affected by the explosion of interest rates in the early 1980s. If you do not expect that to be repeated, then the volatility ofbonds will be less than indicated. The conclusion would be that a higher percentage of the portfolio should be invested in bonds and a lower percentage in equities if downside risk is to be avoided.
When I saw some large negative real returns in the data for the 1960s and 1970s, I thought that errors had crept in. How soon we forget! It took years for most of us really to absorb the extent to which inflation and taxes were eating up, or more than eating up, our high nominal returns. At least charities and foundations did not have to pay income taxes on the nominal interest.
The Past Eight Years
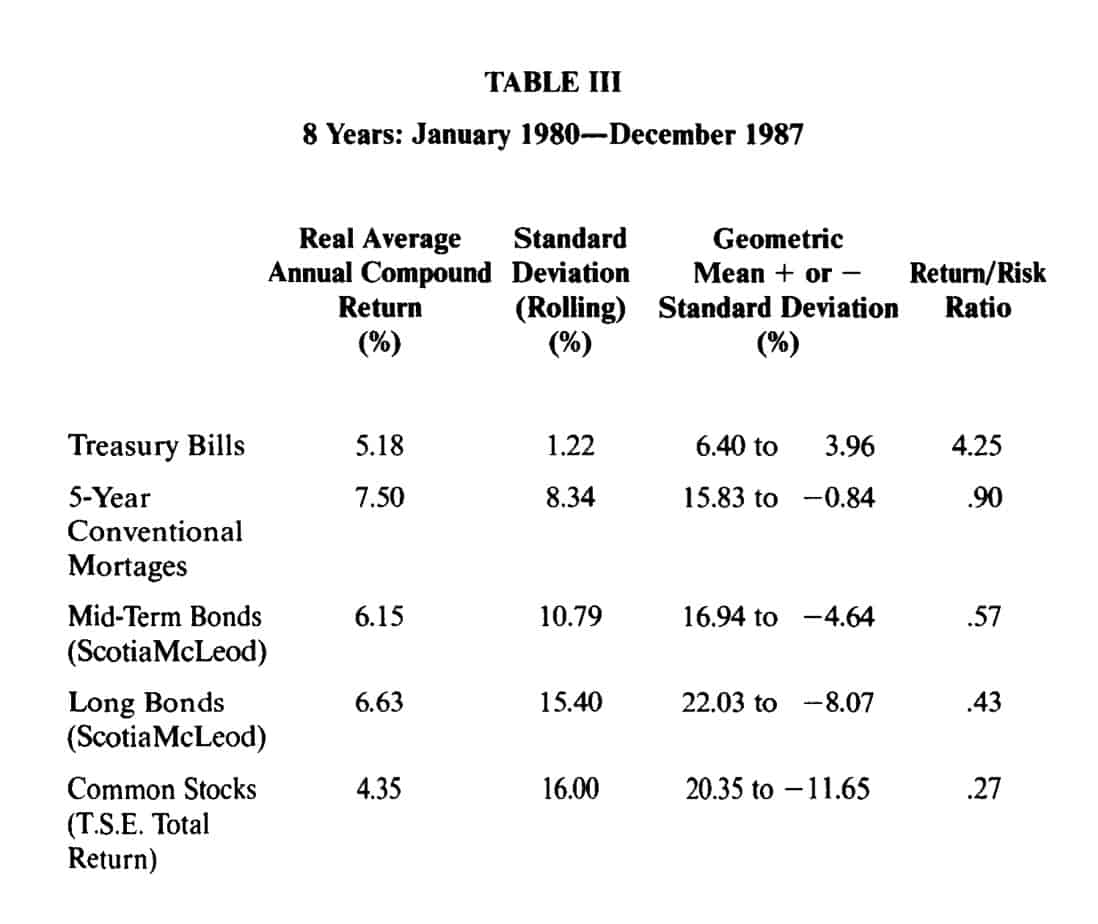
In the early 1980s, bonds fluctuated much more wildly than in previous years but, for this decade as a whole, they have fluctuated a little less than equities.
With the 1980s, we can now add mid-term bonds to the list of investments. Over these years, and probably others, their volatility is less than for long bonds. This is what standard bond theory leads us to expect, except that midterm bonds fluctuated more than most investors would expect. That is, the fluctuations of mid- and long-term bonds are more similar than theory would lead us to anticipate. Mid-term bonds are of shorter duration and always swing less in price for a given change in yield; however, mid-termyields have swung more than long-term yields in this decade.
In other words, mid-term bonds are safer than long-term bonds, but not as safe as conventional wisdom would lead us to expect. This period has also seen a change in the debate about debt as against equity; the returns on bonds have risen. (Over the last five years, the return on long bonds was just marginally ahead of that for stocks, mortgages and mid-term bonds trailed below both, and treasury bills lagged behind all of them, even when the crash is included.)
The Last Eight Years: January 1980 to December 1987
Table III shows the pattern for the last eight years.
In this case, we need to use the standard deviations of the annual returns, not the four-year rolling returns, because the number of years in the sample is small. This is unfortunate, because the variability of bond prices has actually shot up in this period, partly because the United States Federal Reserve Board changed its policy from one directed at moderating interest rates to one directed towards moderating money supply and reducing inflation.
TABLE III (see image)
Mortgages also fluctuate much more now. Until a decade or so ago, institutional mortgage departments were given a budget for three or six months or more. The rates that were set reflected the market for mortgages to a large extent independently of other investment markets. This pattern gradually changed. Now that consumers have become more sophisticated and knowledgeable, and market rates for guaranteed investment certificates (GICs) can change hourly, institutions have learned, sometimes the hard way, the need to balance asset and liability returns continuously.
That is why mortgage rates now move rapidly whereas they used to move very gradually, smoothing out the peaks and valleys of more volatile markets. With this increase in volatility, the statistical and historical stability of mortgage returns have probably changed.
Some General and Subjective Observations
l. One influence that cannot be measured has not yet been considered here.
There has been a massive increase in debt in all sectors in Canada, the United States and around the world. Our federal, provincial, corporate and individual borrowings have risen. The pattern in the United States is worse in respect ofleveraged buy-outs,junk bonds, and consumer profligacy, but their federal deficit isn’t as serious in relatives terms as Canada’s. Everyone is aware of the debt problems of developing countries, but this is a relatively small part of the total problem.
One part of the phenomenon is the many billions of dollars of intra-day loans that are literally revolving continuously around the world. This is fun as long as the party lasts but, until recently, the risk of international collapse was rising exponentially. Now the situation is deteriorating more slowly, although that is hardly a cause for optimism.
There is obviously no way to forecast currently the timing of an international debt collapse. We do know, however, that its effect on equities would be much more drastic than its effect on bonds, because equities are junior securities; by definition, leveraged more than bonds.
2. The globalization of markets is a fascinating development and can improve liquidity but it does not necessarily increase stability or investment returns. Recent developments like globalization, computer trading. and index options and futures have compressed action in financial markets into much shorter time frames. Many Americans and Canadians start their days with television market reports such as those on CNN, which offer global investment information. They want to know the currency and equity-market activity that has occurred in Japan and Europe before our business day begins. The financial world at least really is getting ‘”smaller”‘.
3. The return on utility stocks has been higher, and the volatility lower, than the return and volatility of equities in general over the last decade at least.
4. While it is not within the scope of this article, readers may wish to note that diversification among various maturities has also, historically. been beneficial to investors. This practice will moderate swings in prices while providing returns that fall between the best- and the least-performing maturities. Investors should not, however. expect to he able to correctly ”call” most swings in bonds. The fate of the loans made by the Canadian credit union movement to Osler Inc. should he sufficient to convince even diehards of the need for diversity in investments. Osler’s default had an effect on the credibility of credit unions across the country.
5. The probability is increasing that inflation-indexed bonds will be offered both here and in the United States although I am not aware of any being offered at the present time. New demand may come from pension funds as the rules of their game change.
6. Do bond and stock markets move together or not? The classical view is that they do not. Inflation has a similar effect on prices in both markets; however, capital losses offset higher income, so the effect of inflation on total returns statistically is very weak. In the last 31 years, the returns moved in the same direction in 16 years; in opposite directions in 15 years. Monthly data indicate that there now is a slight positive correlation between bond and common stock prices.
Summing Up
Foundations, endowments and charities are different from other investors because they tend to be perpetuities and so may be more oriented to the longer term. Since, typically, they do not have a stable source of income, they probably have different objectives from mutual funds and pension funds.
Research, covering three time periods (one extending over more than six decades) demonstrates once again the advantage of diversification of investments. Historically, the inclusion of both bonds and stocks in a portfolio has produced both higher returns and lower risk than a portfolio invested only in bonds. This is a direct contradiction of the traditional wisdom which insists that higher returns are usually associated with higher risk.
Since experience has shown that attempts to time the increases or decreases of investments have more often than not been unsuccessful, a portfolio with a relatively stable percentage invested in equities is recommended.
FOOTNOTES
1. Arthur Pearson, “Solutions to the 20-Per-Cent Problem”, The Philanthropist. Vol. VII, No.2, pp. 28-39.
2. John H. Hodgson.”What Is Capital? What Is Income”, The Philanthropist, Vol. VII, No.2, pp. 24-32.
3. Actual returns in current nominal dollar terms before adjustment for inflation may be obtained on request from Auriga Financial Consultants Inc.. 131 Strathallan Blvd., Toronto, M5N 1S9.
4. Chua, Woodward and To, “Potential Gains from Stock Market Timing in Canada”,
Financial Analysts Journal. September-October, 1987.
5. Fuller and Wong, ‘Traditional versus Theoretical Risk Measures”, Financial Ana
lysts Journal. March-April 1988.
6. Standard Deviation is a statistical measure of the dispersion of results about the mean value. About 68 per cent of results in a normal sample will range within one standard deviation above and below the average. This measure takes into account not only the probability and magnitude of a range of outcomes. but also the amount the actual return is likely to diverge from the expected return.
7. The 64-year study of bonds is based on the ScotiaMcLeod (formerly McLeod Young Weir) Long-Term Bond Index between 1948 and 1988. This reflects a weighted universe of Canadian long bonds. Between December 1923 and 1947, indices prepared for the Canadian Institute of Actuaries have been used and linked to the ScotiaMcLeod Index. The indices prior to 1948 are based on Government of Canada bonds over 10 years in term.
8. “Common stocks” refers to the Toronto Stock Exchange 300 Composite Total Return Index from 1956 to 1987. For 1950 to 1956, the Hatch-White reference (see Selected Sources infra) was used. Figures from the C.I.A. study for the period prior to that were linked to this and the T.S.E. Index.
9. Data prepared for this report are too extensive (and difficult to read) to include but may be obtained from Auriga Financial Consultants. (Footnote 3, supra.) The amount of data required for this study (over 600,000 bytes) is not at all exceptional these days but I find it interesting that this would have exceeded all of the memory of the University of Toronto’s first Univac, the second one in Canada, which was “advanced” technology only about 40 years ago.
10. Supra, Footnote 3.
Books
SELECTED SOURCES
I. Canadian Institute of Actuaries, Report on Canadian Economic Statistics. 1924 to 1987. Montreal: Canadian Institute of Actuaries (unpublished report), 1988.
2. Hatch, James E. and White, Robert W. Canadian Stocks. Bonds. Bills and Inflation: 1950-1983. Charlottesville, VA: The Financial Analysts Research Foundation, 1985.
3. Institute of Chartered Financial Analysts. TheChallenges of Investing for Endowment Funds. Charlottesville: Institute of Chartered Financial Analysts, 1987.
4. Institute of Chartered Financial Analysts. Determinants of Investment Ponfolio Policy (in particular the chapter on Endowment Funds by Jay Vawter). Charlottesville: Institute of Chartered Financial Analysts, 1981.
5. Leibowitz, Martin L.A New Perspective on Asset Allocation. Charlottesville: Research
Foundation of the Institute of Chartered Financial Analysts, 1987.
6. Maginn, John L. and Tuttle, Donald L. eds. Managing Investment Ponfolios-A Dynamic Process. Boston: Warren, Gorham and Lamont, Institute of Chartered Financial Analysts, 1983.
7. ScotiaMcLeod. Statistical Summary, 1947-1987. Toronto: ScotiaMcLeod, 1988.
8. ScotiaMcLeod. Total Rate of Return on Securities 1957-87. Toronto: ScotiaMcLeod,
1988.
Anicles
I. Chua, Jess H., Woodward, Richard S. and To, Eric C. “Potential Gains from
Stock Market Timing in Canada.” Financial Analysts Journal (September-October,
1987).
2. Fuller, Russell J. and Wong, G. Wen chi.”Traditional versus Theoretical Risk Measures.” Financial Analysts Journal (March-April 1988).
3. Garcia, C.B. and Gould, F.J. “A Note on the Measurement of Risk in a Portfolio.”
Financial Analysts Journal (March-April 1987).
4. Hodgson, John H. “What is Capital? What is Income?.”The Philanthropist (Vol. VII, No.2): 24-32.
5. Perold, Andre F. and Sharpe, William F. “Dynamic Strategies for Asset Allocation.” Financial Analysts Journal (Jan.-Feb. 1988).
6. Society of Actuaries. Quanrifying the C-1 Risk (Defaults in Fixed Dollar Investmenrs and Market Value Changes in Equity Investments). Panel Discussion at Society of Actuaries Meeting, New York City, May, 1987.
7. Wolman, Clive. “Beloved ‘Efficient Market’ Theory Falls on its Face after Stock Crash”. Financial Post (April 6, 1988).
ROBERT ANGLIN
President, Auriga Financial Consultants Inc., Toronto