Introduction
Canada was one of the last countries to experience the world economic crisis of 2008-2009 and one of the most stable economies emerging from it. However, the nonprofit sector, like the private and public sectors, was not immune to the rapid impact of the economic downturn. Traditional sources of stable funding for the sector (governments, foundations, corporations, and individuals) all experienced the impact of the economic crisis, putting the nonprofit sector at risk at a time when the need for its services was growing due to increasing financial and other pressures on families.
Many of NACY’s member agencies across Canada have reported that they are struggling with challenges of capacity, service delivery, and sustainability. More agencies are relying on volunteers, community donations, and goodwill while often trying to survive on inconsistent and patchwork funding. In addition, increased numbers of Canadian families are at risk, as evidenced by persistent high rates of child and family poverty and homelessness, as well as high levels of unemployment and precarious employment, especially among young people. These factors have created increased demand for service, which in turn has challenged the effectiveness of service delivery. At the same time, there are community agencies often working in silos without the benefits of networking, an appropriate level of learning capacity, or economies of scale. In order to increase organizational capacity and help struggling agencies survive, it is important to capture and share experiences, new models of service delivery, and new approaches to improve service effectiveness and efficiency.
With a major multi-year grant from the Government of Canada’s Social Development Partnership Program at Human Resources and Skills Development Canada, the National Alliance for Children and Youth undertook the “Taking Stock” project to provide the knowledge and leadership required to mobilize organizations in communities across Canada and to identify how the economic crisis has influenced the child and youth sector. The project set out to identify ways and means to address the challenges faced by the sector in order to ensure that Canadian children, youth, and families continue to have access to the supports and services that they need, and that child- and youth-serving agencies have the capacity and resilience to operate effectively in this new economic reality with the necessary capacity and resilience.
Methodology
NACY used a multi-pronged approach to take stock of what has been happening in the child- and youth-serving sector since the 2008 economic downturn. The “Taking Stock” project looked not only at the challenges faced but also at how organizations have responded to these challenges in the changing fiscal and service environment.
Four regional think tanks were held in Ottawa, Halifax, Toronto, and Vancouver, bringing together more than 120 leaders of the sector in frank face-to-face discussions about the challenges facing Canadian children, youth, and families—and the organizations that serve them. Speakers presented ideas and information to help identify issues and trends. Discussions were facilitated to encourage participants to interact and share their own experiences and perspective. For a complete list of think tank participants, visit the NACY website at www.nacy.ca.
Key informant interviews were conducted with 22 thought leaders from the sector who, because of their experience and roles, had unique perspectives on what is happening in the country today. This added greatly to our understanding of the issues and opportunities facing the sector. Individuals were sought from a broad range of organizations and geographic locations to ensure that we captured the perspectives of people with an in-depth understanding of what was unfolding across the country and who could provide an informed on-the-ground view of issues in the child and youth sector. For a list of key informants, please visit the NACY website at www.nacy.ca.
These interviews also helped to identify potential case studies that would describe how a range of organizations were successfully responding to the challenges they face. The case studies were chosen based on a number of factors, but the key criterion was that the organization had successfully addressed an issue that would be relevant to others faced with sustainability, service delivery, or capacity-building challenges. NACY looked at agencies of different sizes and mandates located in various geographic settings. The agencies were a mix of small, medium, and large organizations, serving both urban and rural constituencies in different regions of the country, with a mix of mainstream and more specialized mandates. The selected agencies, therefore, reflected the diversity of the sector and clients served to ensure that the case studies would have broad applicability. The case studies do not showcase model agencies but, rather, highlight agencies that are successfully wrestling with the issues faced by organizations across the child and youth sector. These case studies are available at www.nacy.ca/taking-stock.
The case studies were supplemented by further conversations and informal discussions held throughout the project to ensure that we had a comprehensive picture of issues that were broadly applicable and representative of the child- and youth-serving sector.
NACY also conducted an online survey of its members and their local affiliates on the impact of the world economic downturn to understand how the economic turmoil, which began in 2008, has affected them. The survey also established a baseline for assessing the ongoing impact of the economy on organizations and the communities they serve. This article reports the findings of the online survey.
The survey was conducted in late 2010 and early 2011. Respondents were asked to provide information about the state of their organizations as of April 1, 2010, which was the beginning of the fiscal year for most organizations. In total, 428 organizations responded in part or fully to the survey.
While the majority of respondents identified their organizations as being from the social service sector, there were also responses from advocacy, health, arts, and sports and recreation organizations, as well as from funders and national umbrella groups. Not all respondents completed all survey questions, but the overall results provide a good indication of activity levels and operations from a representative sample.
Although there was variation in the questions and details explored in the data collection activities, the overall approach was consistent so that the project team could analyse and synthesize the responses.
Survey results
The child- and youth-serving sector in Canada is made up of thousands of formal and informal organizations that operate across and within a diverse range of social, educational, health, arts, recreational, and advocacy mandates. Collectively they have an impact on the lives of almost every family in Canada. Indeed, this is a rich amalgam of many sub-sectors, each of which contributes to the well-being of children, youth, and families across the country. In order to better understand the diversity of service provision in Canada, the survey first collected basic demographic information and service delivery characteristics from each respondent. It then asked respondents about challenges and threats to their organizations and how they were coping with these. Although these data reflect the actual reality of 428 organizations that responded to the survey, we believe the findings to be broadly representative. Please note that results are rounded to the nearest percentage point and therefore the tables do not always add up to 100 percent.
Table 1: In what year was the organization founded?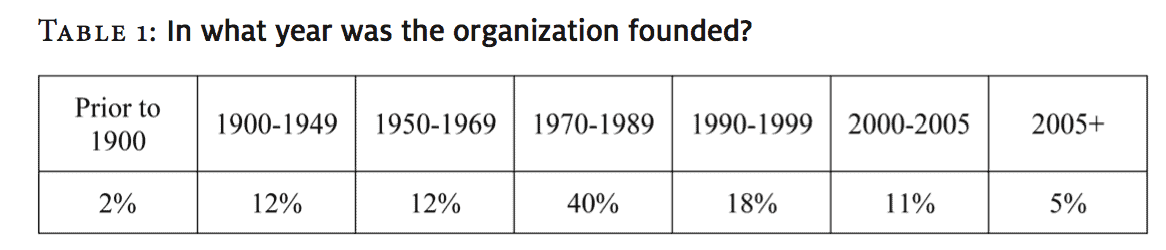
Responding organizations have been in existence for varying lengths of time (see Table 1). Some are well over a hundred years old, while others were established only in the past decade. About three-quarters, however, were founded after 1969 (and one third after 1989). This reflects the ability of Canadian society to respond to changing needs by initiating new types of services and activities. Just over 75% of respondents identified their organizations as registered charities.
Table 2: In what province or territory does the organization operate?
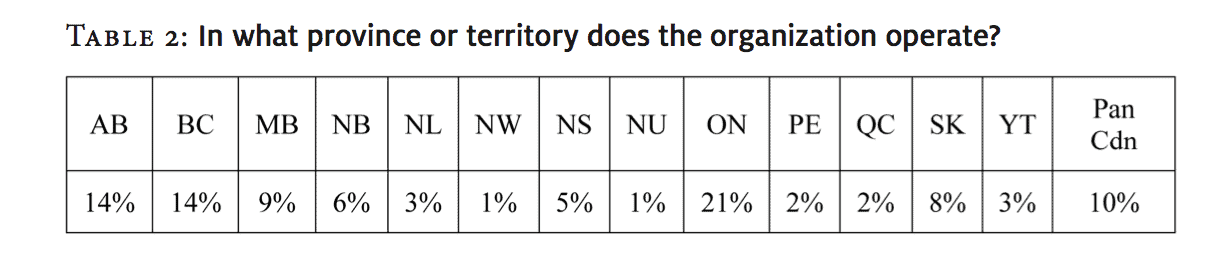
Responding organizations operate in every jurisdiction in Canada. Table 2 indicates the largest concentrations: Ontario (21%) and Alberta and British Columbia (14% each).
Table 3: In what setting does the organization operate?
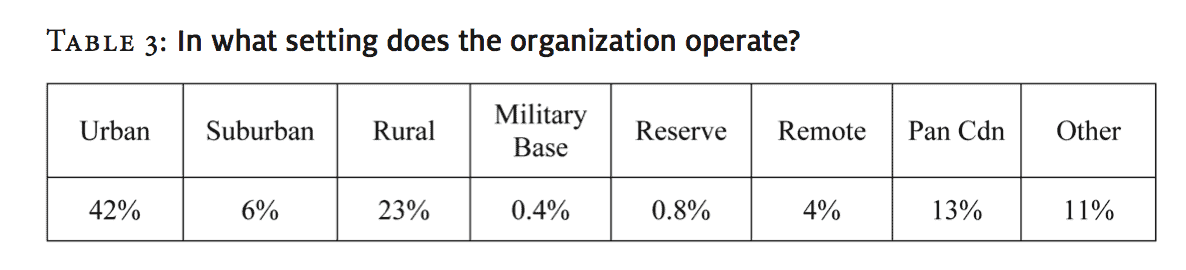
Responding organizations were located in every type of community setting, with the largest concentration (42%) in urban areas (see Table 3). The “Other” category comprises organizations that operate in more than one type of setting.
Table 4: What is the operating budget of the organization, and what is the source of its income?
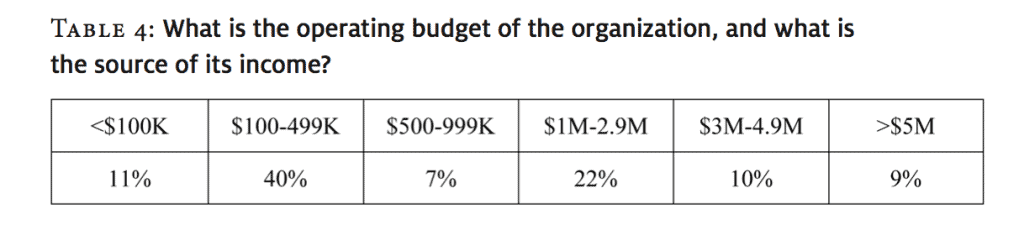
The annual operating budget of respondents ranged from $8,000 to $14.5 million, with the largest concentration in the $100-$499 million category. Table 4 shows that a significant number (22%) had annual operating budgets of between $1 million and $2.9 million.
Figure 1: Has your organization experienced increases or decreases in your funding in the past year?
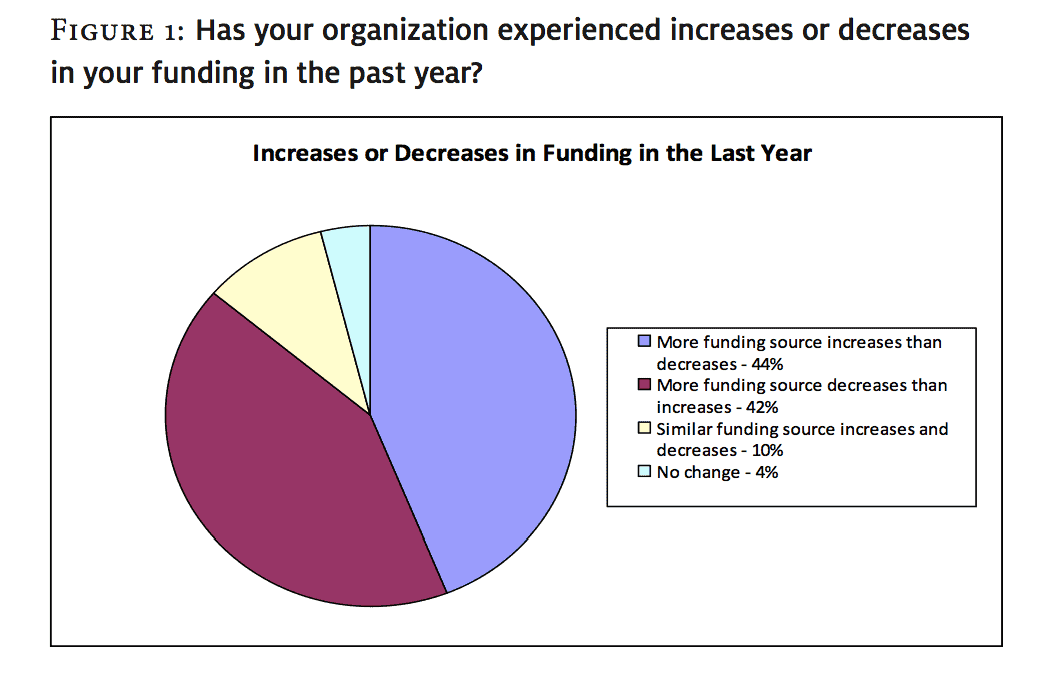
There was no clear indication from responding organizations that collectively they were financially worse off in the recent past than in previous years. What is evident in Figure 1, however, is that organizations had experienced a great deal of financial instability. Slightly more organizations reported more funding increases than decreases in funding (44% vs. 42%), and only 4 percent reported no change at all. Instability of this nature means that even organizations that have experienced more funding increases than decreases likely had to devote more resources to chasing dollars, in many cases drawing time and energy from other activities at a time when demand for services has been increasing.
Table 5: How many full-time equivalent staff are employed by the organizations?
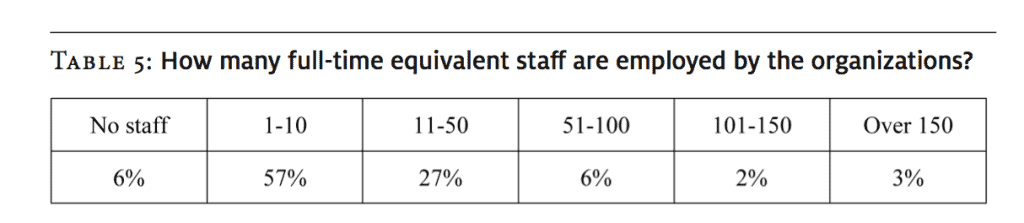
The vast majority (90%) of responding organizations were quite small, with fewer than 50 employees. Of these, 63 percent have 10 or fewer employees (see Table 5).
Table 6: How many volunteers are utilized by your organization?
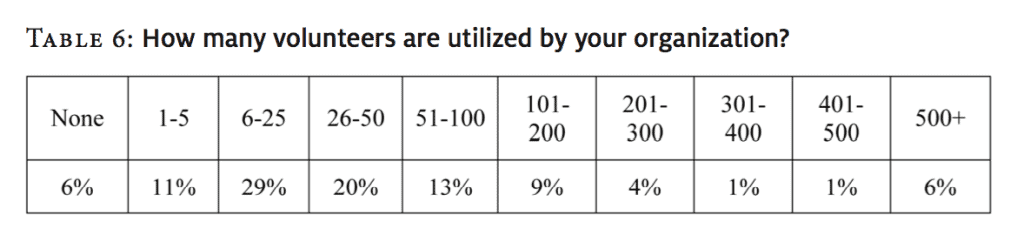
Table 6 shows the importance of volunteers to responding organizations. Nearly half (49%) involved between 6 and 50 volunteers. Only a small percentage (6%) had no volunteers at all. At the other end of the spectrum, two organizations reported that they had over 10,000 people volunteering, and another reported 30,000. This is an extraordinary statement about the commitment of our citizens to the well-being of children and families in our communities. It should be pointed out that recruiting, training, and retaining volunteers requires a great deal of effort by organizations. Even when volunteers help to fill gaps in the delivery of services, as result of a lack of full-time staff, they still require support.
Table 7: How many clients are served by your organization?
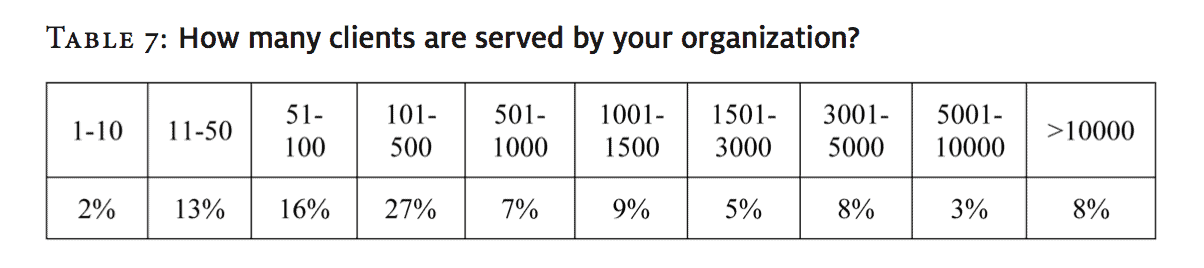
A little more than four in ten organizations (43%) served between 51 and 500 clients. One organization reported serving more than 200,000 people, but this was a national organization with a number of local and provincial branches. The organizations with the smallest number of clients tended to be serving other agencies rather than providing direct client services.
Of responding organizations, 48 percent reported that they provided services to individual clients and other organizations, 42 percent to individual clients only, and 10 percent to organizations only (see Table 7).
Table 8: What is the most significant demographic change you have seen in your service area in the past five years?
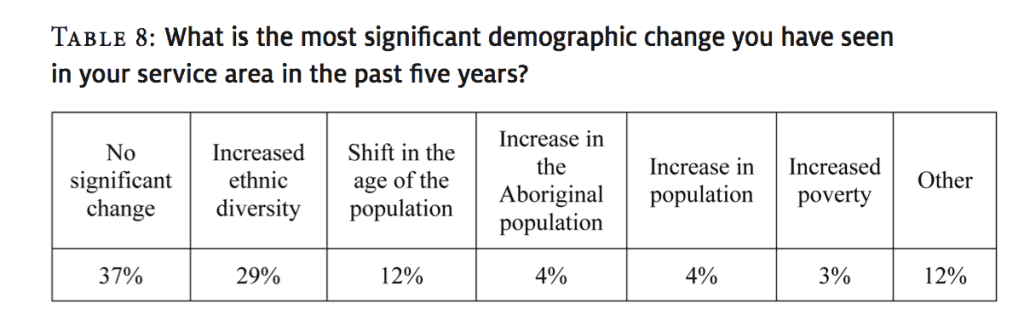
As shown in Table 8, almost two-thirds (63%) of respondents reported significant change in the demographics of the communities served. By far the largest change, reported by just under one third (29%) of respondents, was an increase in ethnic diversity. This included increases in specific ethnic groups, general increases in diversity, and an increased refugee population. Another 12 percent of respondents reported a shift in the age of their client population, including an increase in the number of retirees and seniors, fewer young people and families moving away, an increase of young people moving back, and an increase in young adults and teens. Much smaller changes included the 4 percent who reported an increase in the Aboriginal population (particularly an increase in both the urban-based population and an increase in the child and youth population) and an increase in poverty, reported by 3 percent (particularly an increase in the number of poor families and unemployed people). The 12 percent whose responses are grouped under “Other” includes organizations that mentioned an increase in the number of temporary or seasonal workers, an increase in high school drop-outs, and a greater number of marginalized youth.
Table 9: What is the most significant change you have seen in client needs in the past five years?
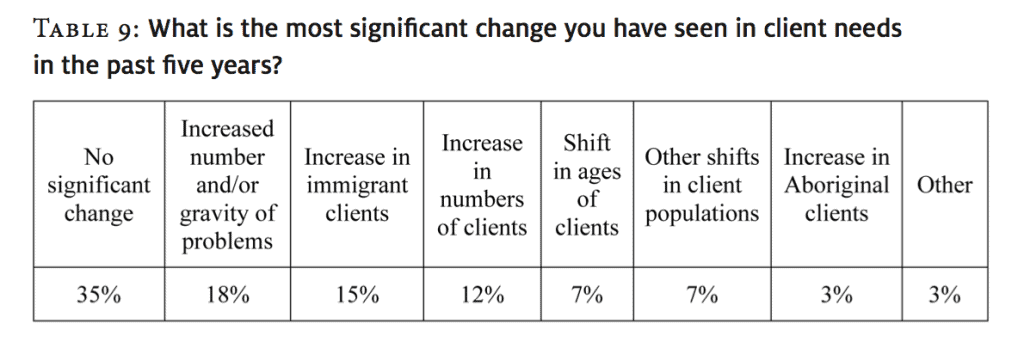
Nearly two thirds (65%) of respondents reported significant change in the clients they served and their needs, while slightly more than one third (35%) reported no significant change. As Table 9 shows, almost one in five (18%) of respondents noted an increase in the severity and/or number of issues faced by clients, including an increase in the number of families in need, an increase in mental disorders, an increase in the number of young people with diagnoses of autism/autism spectrum disorders, an increase in homeless clients with multiple issues resulting from fewer supports in the community, an increase in adults with disabilities surviving their parents, more poor families, and more special-needs and high-risk clients. Also reported was an increase in the ethnic diversity of clients (15%), with more immigrants and refugees coming forward for assistance and an increase in the number of Aboriginal people being served (3%).
About one of every eight respondents (12%) reported a significant increase in the number of clients they served, ranging from a 15 percent increase to a 230 percent increase. Another 7 percent reported changes in the demographics of clients, including a decrease in the number of young children and young families and an increase in the number of youth and seniors. There were also more single parents, both mothers and fathers, and more blended families seeking help.
Overall, organizations reported that the cases they are dealing with are generally more complex than they have been in the past.
Table 10: What are the top three current strengths of your organization in terms of administration/infrastructure?
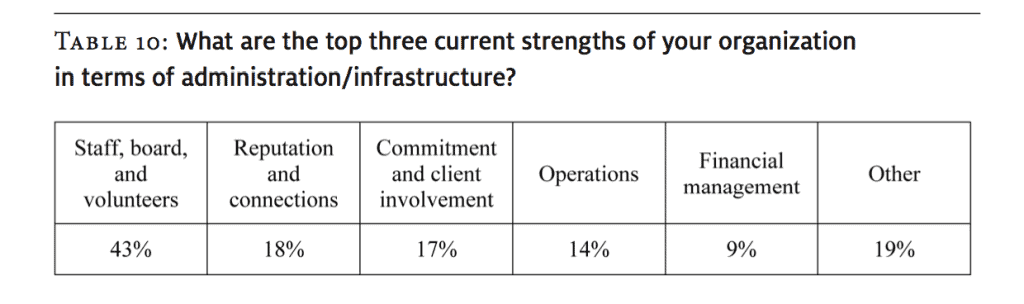
By far the greatest organizational strength, reported by 43 percent of respondents, was human resources: staff, board, and volunteers (see Table 10). Organizations reported that staff members were well qualified and experienced, and that they were able to retain staff in part through ongoing training and support by the senior administration and good working conditions. They also reported that their boards were qualified for their responsibilities, and that they were able to make good use of other types of volunteers from the community. Volunteers were viewed as being very dependable and well supported through training and staff assistance.
The high quality of staff, board, and volunteers contributed to another strength, identified by 18 percent of respondents: the establishment and maintenance of a solid reputation and connections in the community. A number of respondents indicated that their organizations promoted and protected their brand by ensuring that their agency had both credibility and a reputation for being effective in dealing with clients, funders, and other agencies. More detailed views about organizational strengths were expressed at regional think tanks and by key informants.
Only 9 percent of respondents cited financial management as one of the top three strengths of their organization, pointing to their financial planning and accountability procedures and well-developed fiscal controls. These organizations were more likely to have long-term funding commitments, dedicated corporate sponsors, a diverse funding/revenue base, and/or a high success rate with grant proposals.
Table 11: What are the top three current strengths of your organization in terms of your programs and services?
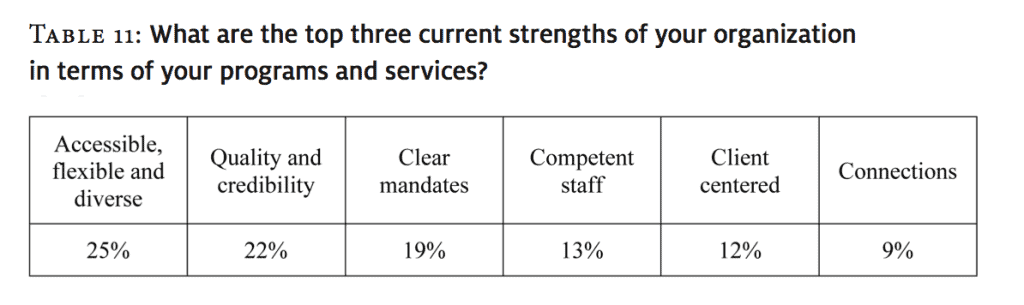
Respondents identified a number of strengths (see Table 11) that help them deal with both day-to-day and longer-term challenges. Among the most frequently mentioned (22%) was the ability to provide credible, high-quality services based upon best practices, expert reviewed programs, ongoing evaluation, the measurement of outcomes and adherence to accreditation standards.
The greatest organizational strengths, reported by one quarter (25%) of respondents, were programs and services that are accessible, flexible, and diverse. Flexibility includes the capacity to adapt to emerging needs and to take advantage of opportunities. Diverse
refers to services that are culturally relevant and responsive to client needs. Accessibility includes ease of access, 24/7 availability, affordability, minimal wait times, a coordinated continuum of care, and comprehensive outreach programs to multiple sites.
Another frequently mentioned strength was having a clear mandate, as reported by 19 percent, and related to having mission and vision statements against which progress and achievement can be measured. Clarity of mandate was also linked to another strength (reported by 13 percent of respondents), the ability to attract and retain competent and passionate staff and volunteers. These strengths also contributed to the credibility and reputation that is important for organizational and program longevity as well as to the ability to connect with community and government partners.
Table 12: What are the top three current challenges to your organization in terms of administration/infrastructure?
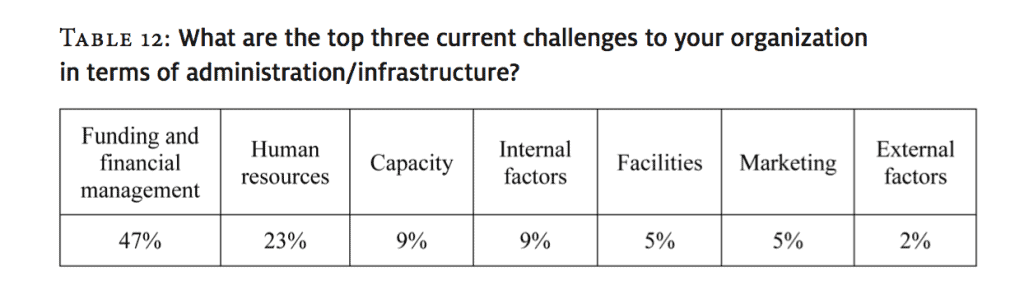
Funding and financial management was the greatest challenge facing organizations, reported by nearly half (47%) of respondents (see Table 12). Among the specific issues reported under the heading of funding and financial management were having to work harder to renew funding each year, an administrative structure overstretched by looking for funding, a large portion of operating budgets going towards fundraising, the need to continually apply for new grants in order to maintain existing programs, balancing the budget to avoid a deficit, and an increase in costs without a corresponding increase in revenue. Also mentioned were an increasingly unstable base of core funding, onerous requirements for applying for funds, and complex accountability reporting to funders, many of whom had their own unique reporting requirements.
Despite citing staff and volunteers as strengths, nearly one quarter (23%) of respondents reported that human resources are a significant challenge. A lack of succession planning for senior leadership and board members was high on the list of HR challenges, as were concerns about staff retention because of low salaries and staff renewal as staff retire. Organizations were also concerned about their ability to recruit a culturally diverse and competent workforce reflective of their clients and communities. Also mentioned were worries about the cultural makeup of boards, board burnout, board governance, and board recruitment and retention. Respondents also noted a declining number of volunteers at a time when there is a growing need for more volunteers to supplement staff.
All other challenges were reported by less than 10 percent of respondents. Among these, the most significant was capacity (reported by 9 percent of respondents), resulting from an increased number of clients and changes in the complexity of their needs and an inability to expand to meet increased demands coupled with declining resources. This challenge is exacerbated by concerns related to facilities (reported by 5 percent of respondents), such as a lack of sufficient and affordable space for programs, chronic under-funding of administrative costs, and a deterioration of buildings and technology
infrastructures. Another 9 percent reported challenges with internal factors, such as administrative structures, communication, and sustaining a common vision and values throughout the organization. By contrast, external factors, such as competing government agendas and shifts in the policies and priorities of government funders, were cited by only 2 percent of respondents.
Marketing was cited as a challenge by 5 percent of respondents. This relates to the difficulty of building community support, creating public and funder awareness, and introducing social networking tools and websites.
Table 13: What are the top three current challenges to your organization in terms of your programs and services?
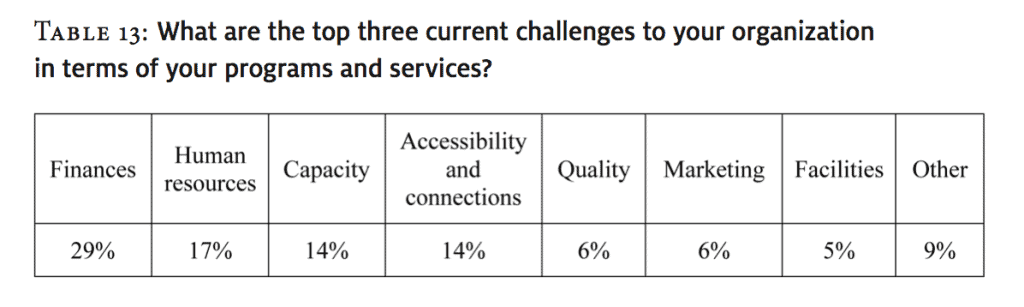
By far the greatest challenge, reported by 29 percent of respondents, was financial (see Table 13). This includes over-reliance on single source funding, inability to obtain adequate funding, onerous funding requirements and restrictions, the high cost of communicating with members, competition for program funds, the cost of staying current with technology, economic stress in certain communities, lack of stable long-term funding, and costs related to accountability and accreditation. Other consequences of these financial challenges included fears among employees and clients of program closings, having to base programming on funding rather than the needs of clients, and disagreements with funders about fiscal realities and client needs.
The next most frequently mentioned (17%) challenge was human resources, including retention, burnout, succession planning, and non-competitive salaries.
Capacity, and accessibility and connections were each cited by 14% of respondents. Capacity challenges included an increasing need for services by the community combined with an inability to expand or add programs; balancing time spent on fundraising and responding to crises versus time spent on programs; increased severity of client and community problems; and an increase in waiting lists. With regard to accessibility and connections, although organizations recognized the importance of partnerships, they also expressed concerns about the costs of maintaining effective collaborations with community and government partners. Respondents identified struggles they had with a lack of collaboration between funders in terms of expectations and outcomes and reported that they believed there was a lack of continuity and consistency in funders’ priorities.
Respondents cited many other program-related challenges, including
• physical space limitations,
• adapting services to meet new needs while being tied down by contracts that leave little or no room for creativity,
• keeping up with changing demographics,
• maximizing cultural relevance,
• providing clinically proven treatments and research-based, up-to-date materials,
• expanding geographically,
• conducting program evaluations and measuring outcomes,
• maintaining adequate supervision,
• client engagement, and
• providing services to rural and remote communities.
A relatively small percentage (6%) of respondents reported marketing as a challenge. This includes educating clients and funders about services and developing low cost and effective marketing strategies.
Table 14: What are the top three threats facing your organization in the next five years in terms of administration/infrastructure?
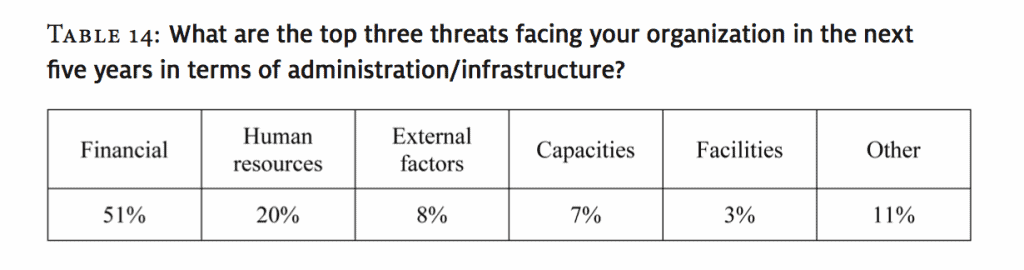
As shown in Table 14, over half (51%) of respondents identified financial issues as the top threat to their organization in the next five years. The list of concerns in this area was extensive and included fears about having adequate resources, attracting donors, and being unable to increase wages. Respondents also worried about a continuing recession, decreased government funding, decreased corporate funding, and the need to run deficits. Some were concerned about the erosion of their endowment funds, ongoing financial instability, the lack of financial sustainability, the inability to obtain grants, and an increased competition for resources. They also identified worries about increased operating costs without a corresponding increase in resources, changing and increasingly demanding reporting requirements, the perceived lack of public understanding about charity expenses, and the lack of recognition by funders and the public of the true costs of providing service.
One in five respondents (20%) cited human resources challenges, including staff and volunteer recruitment, retention, staff burnout, the retirement of key personnel, and a lack of succession planning. Board recruitment was identified as a specific challenge.
Other challenges were cited much less frequently. Eight percent mentioned external factors such as changes in government priorities and policies; changes in the focus of funding programs, regulations, reporting structures, and accountability; and what some perceive to be punitive measures to prevent advocacy. Capacity challenges were reported by 7 percent of respondents. These included concerns about the ability to provide quality services over wide geographic areas, the large numbers of children with increasingly complex needs, having to provide services to more clients due to a lack of government services, achieving more with less, increased client demand due to families economic circumstances, and longer waiting lists. Respondents also mentioned concerns with data collection and storage, demographic shifts, the impact of technology, the movement toward mergers/amalgamations, moving from a paper-based to online-based file system, and the need to communicate to all audiences and stakeholders more strategically than in the past.
Table 15: What are the top three threats facing your organization in the next five years in terms of programs and services?
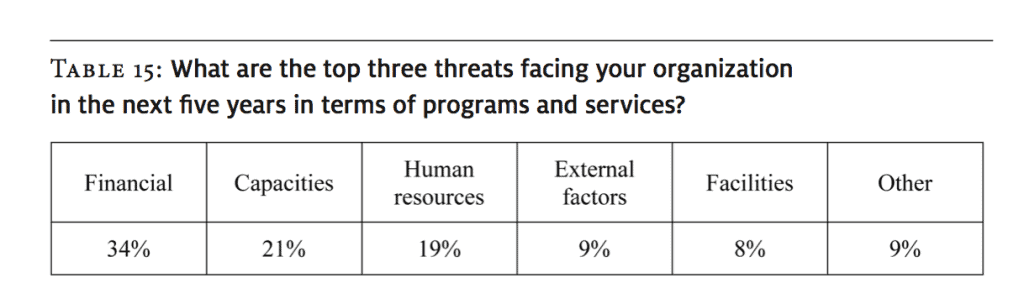
The threats identified to organizational programs and services are closely related to the threats seen for administration and infrastructure (see Table 15). Financial threats were the most frequently reported (34%), followed by capacity (21%), and human resources (19%). Financial threats included concerns about competition for scarce resources, lack of support for program growth, absence of funding for long-term programming, increased operating costs, lack of funding opportunities for prevention programs, and inconsistent funding. With regard to capacity, respondents cited concerns about the capacity to address rapidly growing demand and more complex needs; the ability to do more with less; the inability to adapt quickly to growing diversity; increased community need, and longer waiting lists for services; and being unable to deliver the programs and services that clients need. They also expressed worry about the collapse of community networks and collaborative work with other service providers, a decrease in complementary community services, a decrease in service quality, and a lack of resources required to maintain a meaningful web presence. Human resources threats include the recruitment and retention of staff, volunteers and board members, and the difficulty of finding and retaining staff, specifically in rural communities. Also mentioned were concerns about maintaining staff and volunteer morale in the face of financial pressures and increased service demands.
Perceived external threats to organizations over the next five years, reported by 9 percent of respondents, included changes in provincial governments, changes in the focus and priorities of funders, cancellation of programs, changes in funding criteria, changes in public policy, closure of partner agencies, and federal government downloading of social services to provinces. Respondents also expressed worry about their facilities (8%), specifically, lack of program space, keeping up with technological changes, ensuring client safety, and cultural relevance. Data collection, protection, and storage were also seen as concerns for the next five years.
Figure 2: Do you believe that the survival of your organization is at risk because of the current economic situation?
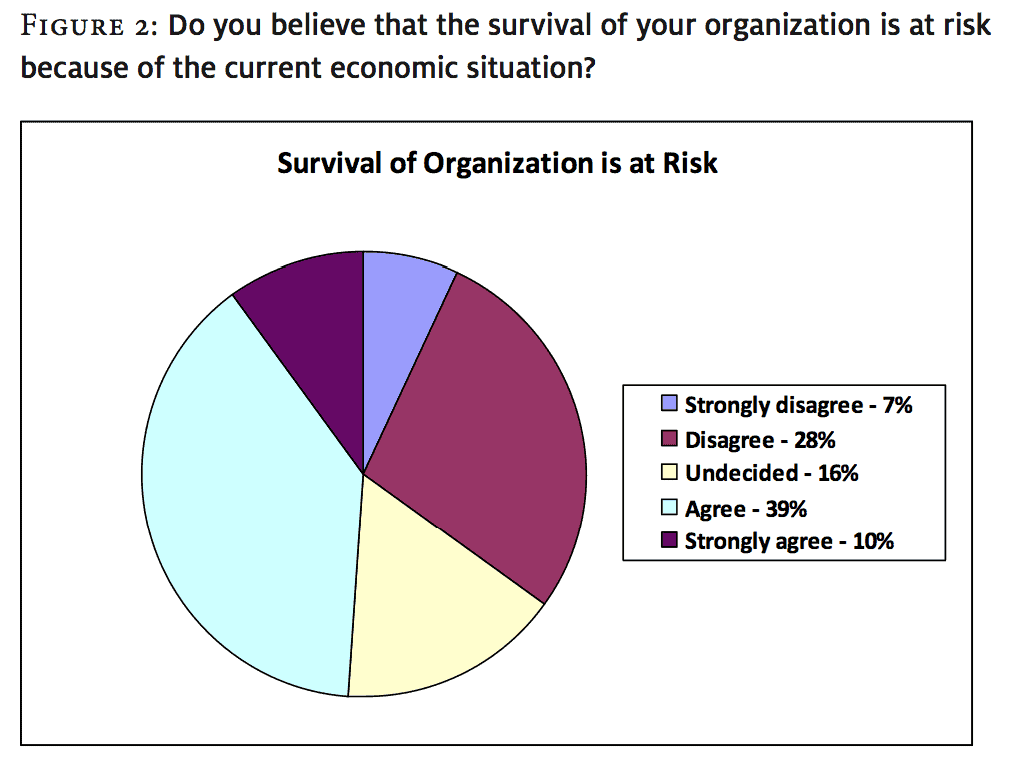
As Figure 2 indicates, almost half of all respondents (49%) reported that they either agreed (39%) or strongly agreed (10%) that the current economic climate posed a threat to the survival of their organization. Just over one third (35%) disagreed (28%) or strongly disagreed (7%) that their survival was at risk, and 16% were undecided.
Figure 3: Do you think there will be an increase in demand for your services because of the current economic situation?
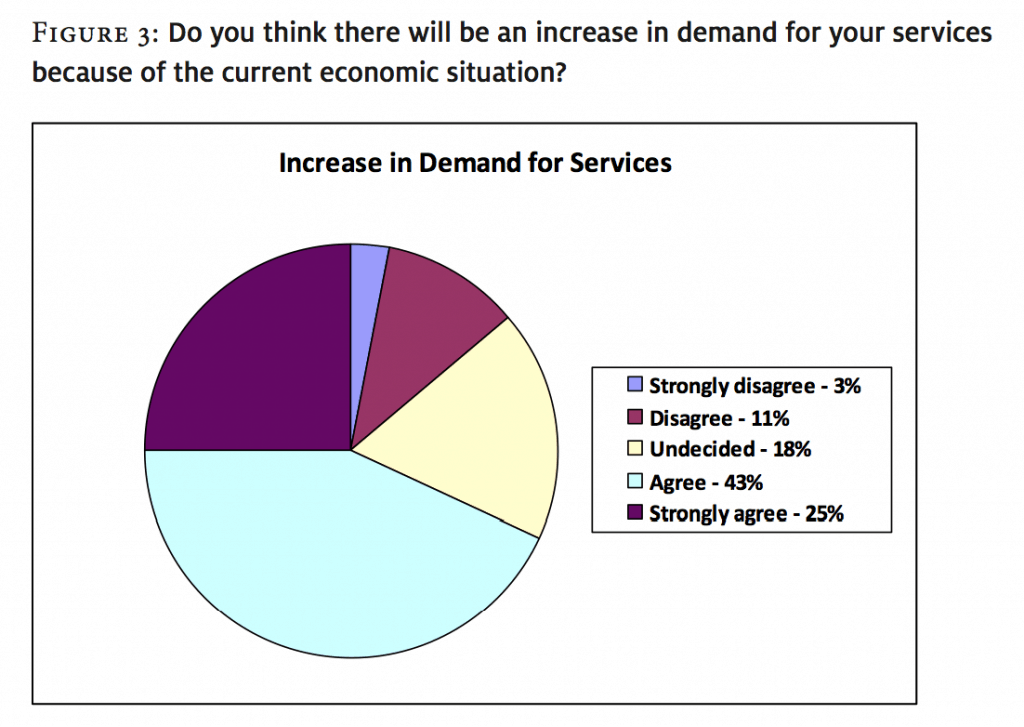
The vast majority of respondents believed that there would be an increased demand for their services because of the economic climate: 69 percent agreed (43%) or strongly agreed (25%) that their organization would see an increase in service demand. Only 18% were undecided, and 14% reported that they did not believe their organization would experience increased demand (see Figure 3).
Figure 4: Do you think your organization will have difficulty meeting your mandate?
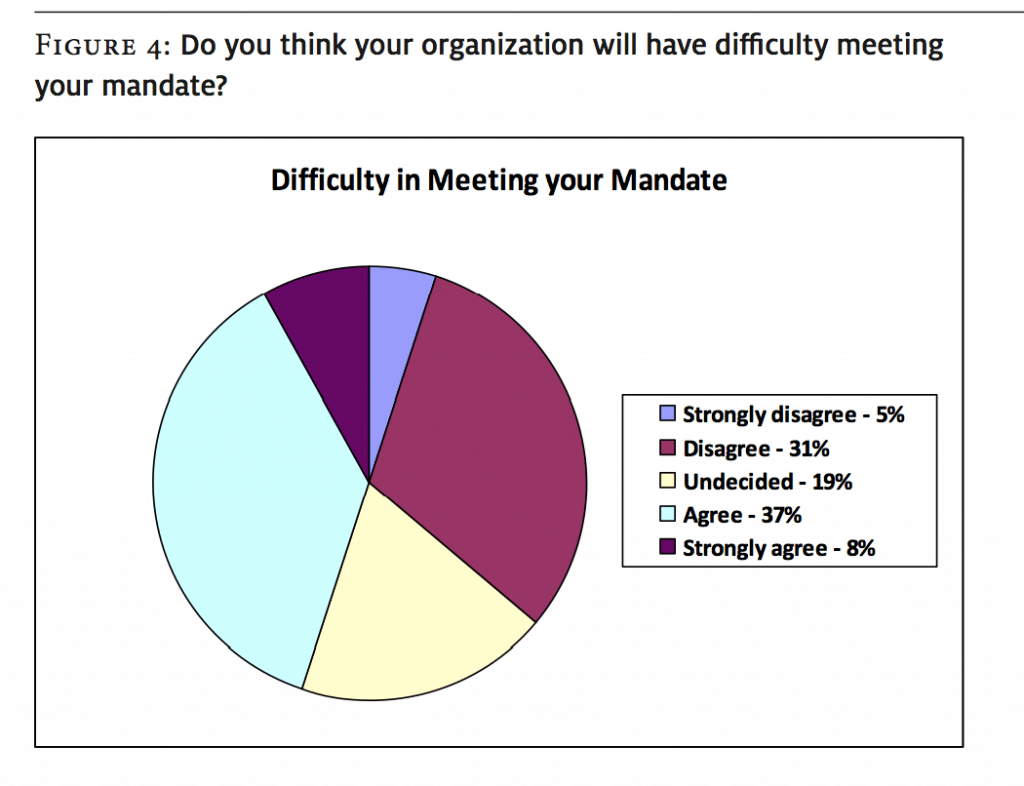
The conflict between survival on the one hand and an increase in demand for services on the other is reflected in the extent to which respondents reported that they would have difficulty meeting their mandates (see Figure 4). Nearly half (45%) agreed (37%) or strongly agreed (8%) that they would have difficulty. Just over one third (36%) thought that they would have no difficulty meeting their mandate, and 19 percent were undecided.
Figure 5: Has the current economic environment had an impact upon your organization?
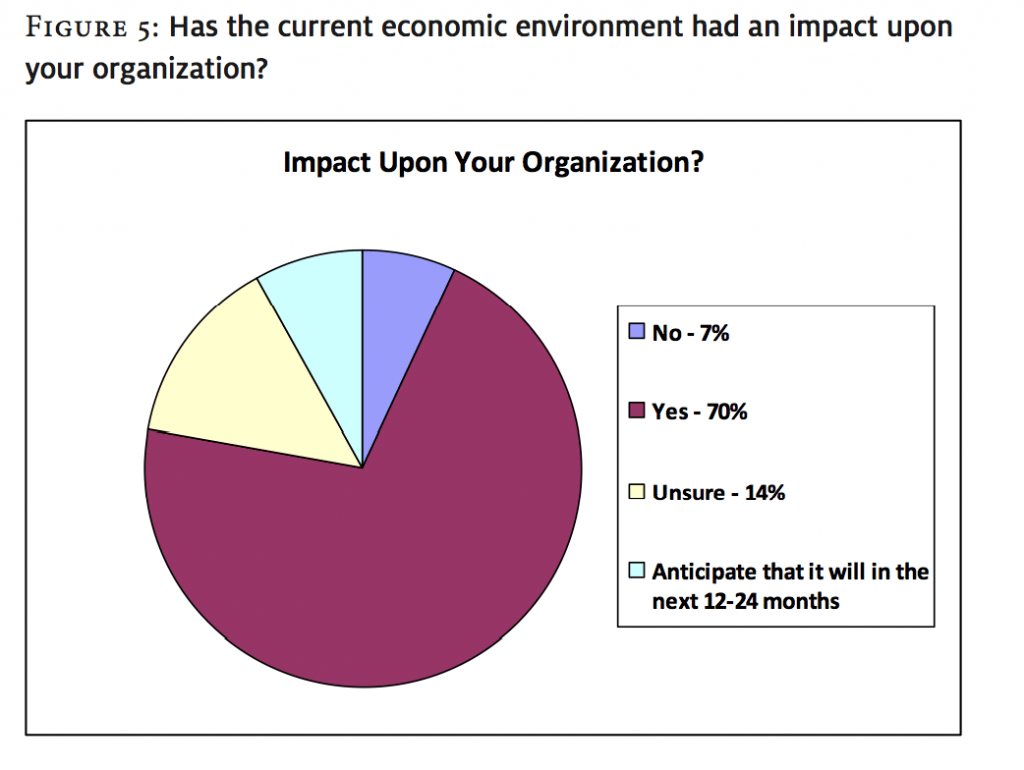
The majority (70%) of respondents reported that the current economic environment has had an impact on their organization. Another 9 percent anticipated an impact in the next 12-24 months. As seen in Figure 5, only 7 percent reported that they have neither felt nor anticipate an impact, and 14 percent were unsure.
Table 16: How have you dealt with the economic situation
|
Obtained revenues from new sources |
11% |
|
Reduced overhead costs |
11% |
|
Collaborated with another organization to reduce expenses |
9% |
|
Reduced spending on training and development |
9% |
|
Increased reliance on volunteers |
8% |
|
Used reserve funds |
8% |
|
Increased reliance on unpaid overtime |
6% |
|
Reduced services or programs |
6% |
|
Reduced number of paid staff |
6% |
|
Reduced number of hours paid staff work |
6% |
|
Eliminated services or programs |
5% |
|
Increased revenues from existing sources |
4% |
|
Explored merging with another organization |
4% |
|
Asked funders to modify terms of existing arrangements |
3% |
|
Reduced salaries/benefits |
2% |
|
Sold assets |
1% |
|
Other measures |
1% |
Organizations reported that they have implemented a number of measures to deal with the impact of the economic situation. Although Table 16 shows that no single measure was identified by a majority of organizations, the most frequently mentioned were obtaining revenue from new sources (11%) and reducing overhead costs (11%). Organizations reported that they coped by cutting back on costs through collaborating with other organizations (9%), reducing spending on training and development (9%), and increasingly relying on volunteers (9%). A smaller number used their reserve funds (8%), required staff to work unpaid overtime (6%), or reduced services (6%), staff (6%), or paid staff hours (6%).
Figure 6: Has the impact on your organization of the current economic situation been positive or negative?
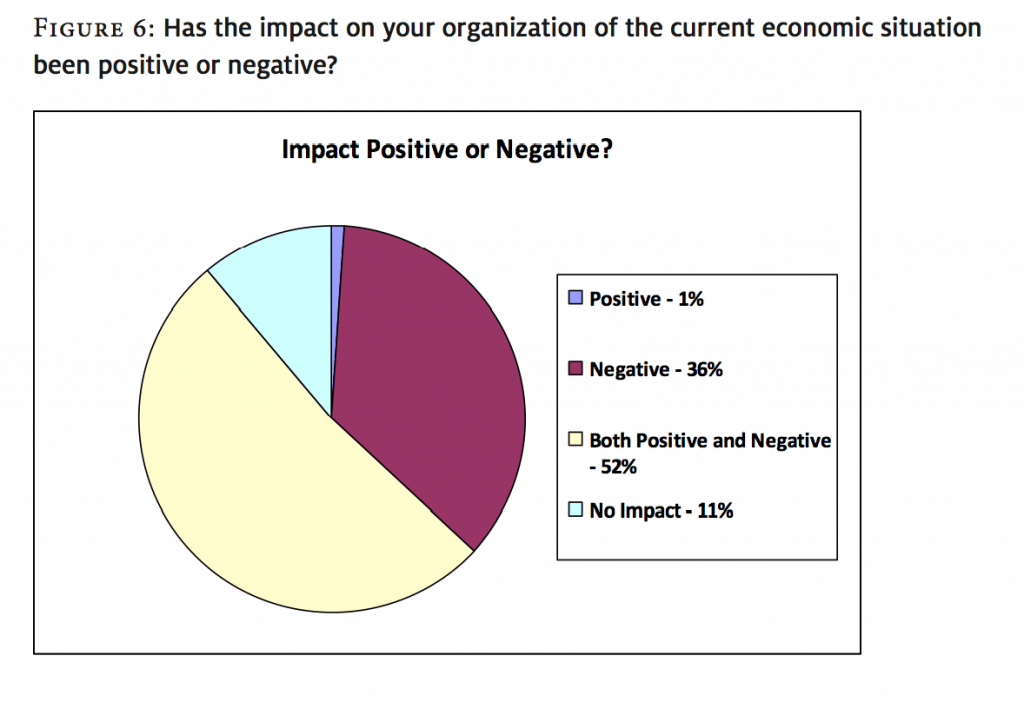
Fewer than 1 percent of the respondents reported that the current situation has had only a positive impact on their organization. Just over half (52%) said that the impact was both positive and negative. Approximately 36 percent reported only negative impacts. Figure 6 suggests that there has been a great deal of recent instability in the sector, given that 88 percent of the organizations surveyed reported at least some negative impacts.
Survey Result Summary
The “Taking Stock” survey collected responses from a diverse group of child- and youthserving organizations that are broadly representative of the sector in Canada. The results, therefore, provide a snapshot of the sector in April 2010 and provide useful measures of the changing environment faced by agencies, with a particular focus on the impact of the economic crisis beginning in 2008.
Overall, organizations reported both increases and decreases in funding in the year leading up to the survey, suggesting a degree of financial instability, with the vast majority of organizations receiving funding from three or fewer sources. Primary sources of funding were provincial and territorial governments as well as fundraising, followed by charging fees for services, and funding from the federal government.
Two thirds of the respondents reported significant changes in both the demographic and ethnic composition of their communities as well as increases in the number of clients, the severity or complexity of their problems, and the overall demand for service.
Agencies rank their staff, boards, and volunteers as strengths, along with their reputation, collaboration with others, and quality of programs and interventions. Their primary challenges, from both an administrative and a program delivery perspective, are overwhelmingly related to funding and the management of financial resources. Adding to their belief that they are already operating in a lean and efficient manner, most organizations report that they are facing a crisis as service demands exceed their capacity to respond in a timely and effective way. This is placing significant strain on human resources as increasing time must be spent on fundraising and accountability while, at the same time, staff budgets and paid hours are being reduced.
Survey respondents consistently highlighted challenges in dealing with funders. Specifically, they mentioned priorities shifting rapidly without consultation, reporting requirements being dramatically increased, and inconsistent and uncoordinated funding criteria. Organizations are struggling to carry on, with nearly half stating that their survival is at risk and two thirds expecting further increases in demand as a direct result of the economic environment. Two thirds also believed that the economic crisis has had an impact on their organizations, with about half reporting that they will have difficulty in meeting their mandates.
It should be noted that when this survey was fielded, many organizations had been under significant strain for some time because of increasing financial and human resource challenges over the past 15 years. The child and youth sector has time and again shown itself to be resilient and able to deal with difficult conditions, but this resilience cannot be sustained indefinitely. Overall, responses to the survey suggest that, for many organizations, this limit may have been reached.
The National Alliance for Children and Youth (NACY) is a coalition of agencies and organizations from across Canada who support and work with children, youth, and their families. For complete information about NACY and for a list of the working group members who produced this report, please visit www.nacy.com . Email: info@nacy.ca .