Introduction
From 2005 to 2009, Canada’s roughly 85,000 charities reported that their collective revenues increased by roughly one quarter, equivalent to an annual growth rate of over 4%. Given this high rate of growth and the economic turbulence of the last few years, it is timely to look more closely at how charities are financed.
Although registered charities data is in some ways more limited than data from the Satellite Account of Nonprofit Institutions and Volunteering, which looks at the financing of both registered charities and nonprofits (Statistics Canada, n.b.a.), it is important to look specifically at the financing of charities for several reasons. First, the data on charities is publicly available and frequently used by journalists in their coverage of the sector. Second, many policy-makers use this lens to look at the sector and are not as familiar with data that incorporates the nonprofit component of the sector. Third, because data for each individual charity is available (rather than the aggregate data of the Satellite Accounts), a greater variety of analyses can be conducted.
Data quality
This column uses data from a subset of the T3010a and T3010b Registered Charity Information Returns filed with Canada Revenue Agency, covering the period 2005 to 2009. T3010 returns are filed annually by registered charities and contain considerable information on the finances of the charities, including amounts and sources of revenue. Unfortunately, the rate of error in these returns is relatively high and only a subset of the information can be reliably used for analysis. As a result, the analysis presented here draws on returns from 89% to 91% of charities, depending on the year. These charities represent between 92% and 97% of total reported revenues for the charitable sector in any given year (see Table 1).
Table 1: Percentage of registered charities and total revenues included in analysis, by year. 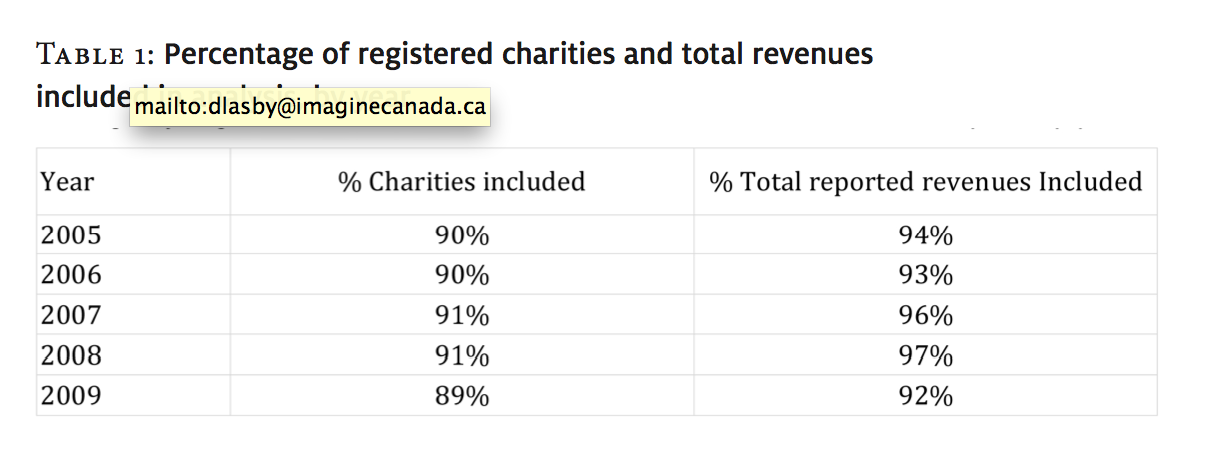
Financing of the charitable sector
As mentioned previously, total revenues for registered charities increased significantly over the period studied. Between 2005 and 2009, total reported revenues for the charities included in this analysis went from $143 billion to $177 billion.2 This is an increase of almost 24%—equivalent to annual growth of 4.4%.3 At first glance, the size of this increase may seem difficult to believe, but it is paralleled by data from the Satellite Account of Nonprofit Institutions and Volunteering, where total revenues increased by 29% over the five years between 2004 and 2008 (Statistics Canada, n.d.b).
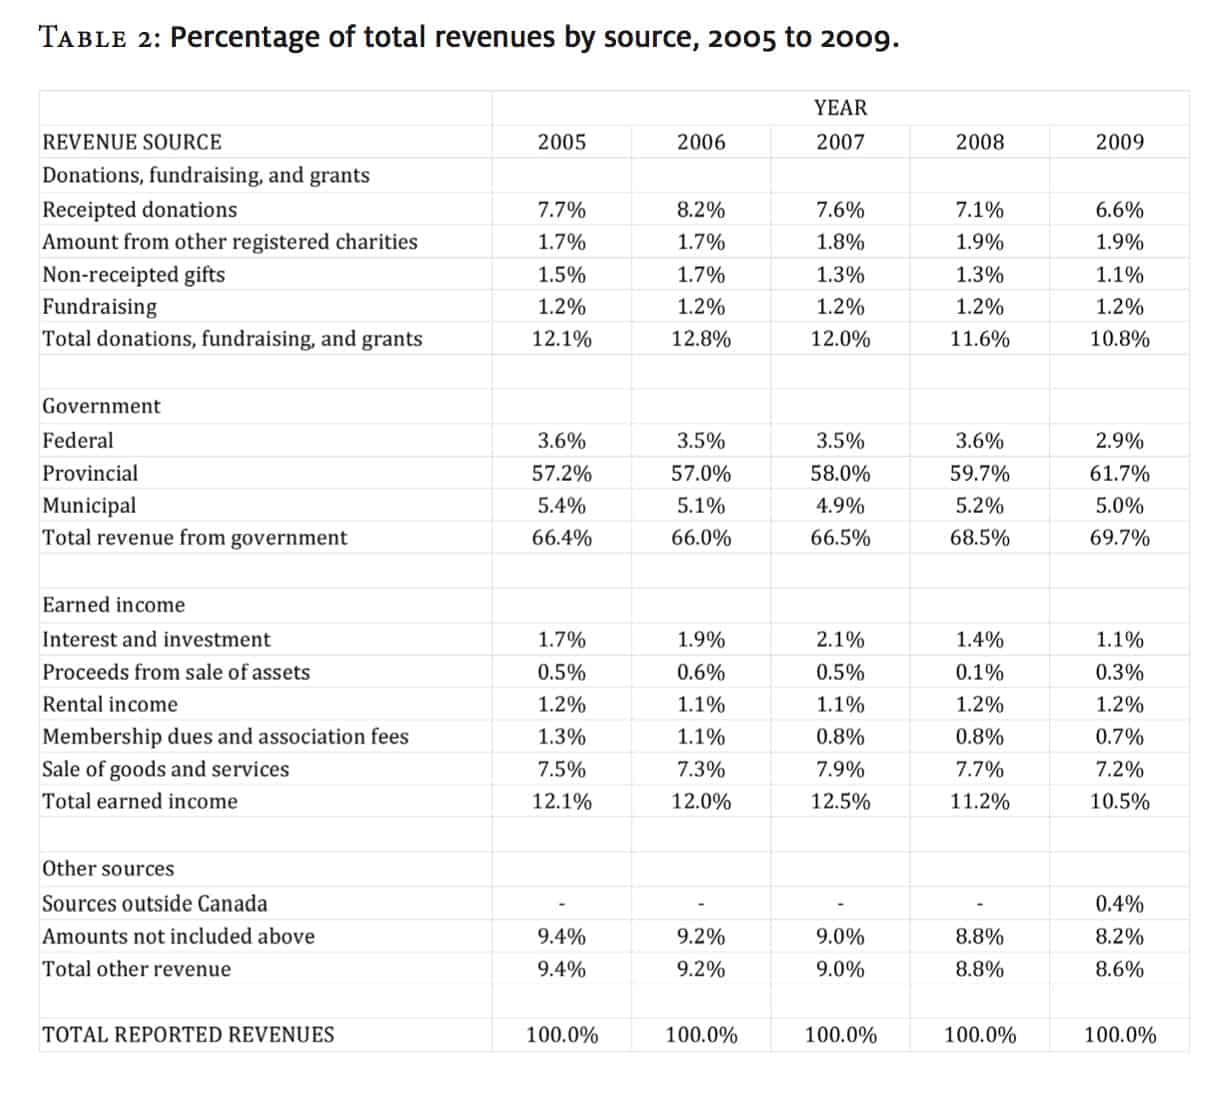
Looking at the charitable sector as a whole, government funding accounts for two thirds or more of total revenues between 2005 and 2009 (see Table 2). The bulk of this revenue comes from provincial governments. As recorded by the T3010, government revenue includes both earned income (i.e., goods and services provided by the charity and paid for by government) and other forms of financial support. Donations, fundraising, and grants collectively account for roughly 11-12% of total revenues, as does earned income, which is dominated by sale of goods and services.
In terms of trends, government funding increased slightly in importance over the period studied. In contrast, donations and interest and investment income decreased in importance in 2008 and 2009, compared to previous years. Both these declines are likely attributable in major part to the economic downturn in late 2008 and the uncertainty that has followed.
Table 2: Percentage of total revenues by source, 2005 to 2009.
The impact of hospitals, universities, colleges, and school boards
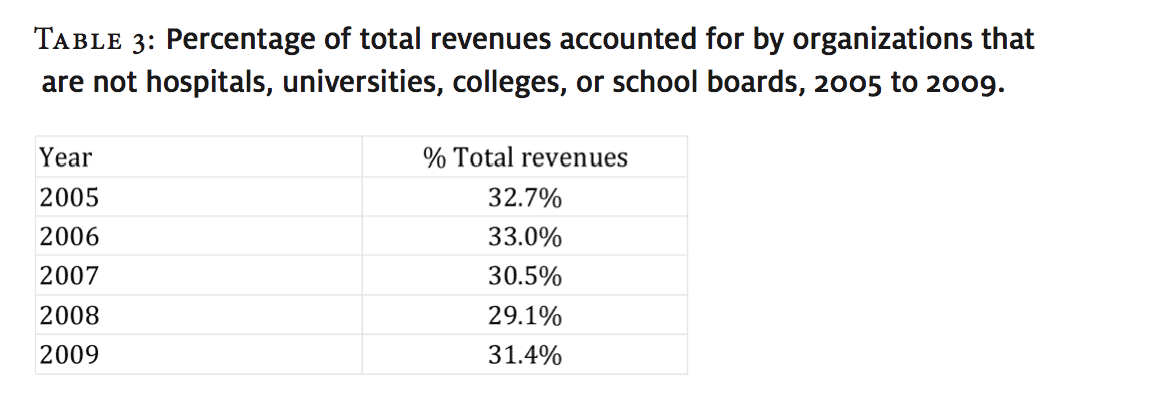
In interpreting these findings, it is important to keep in mind the impact of hospitals, universities, colleges, and school boards. These charities have a much greater effect on the overall picture of charity financing than their numbers alone might suggest. Although organizations are comparatively fewer in number, many have extremely large revenues. Collectively, they account for approximately two thirds of total revenues for the charitable sector. They are generally financed very differently from other charities and, as a group, are more heavily dependent on government funding. The “core” sector (excluding hospitals, universities, colleges, and school boards) accounts for approximately one third of total revenues (see Table 3).
Table 3: Percentage of total revenues accounted for by organizations that are not hospitals, universities, colleges, or school boards, 2005 to 2009.
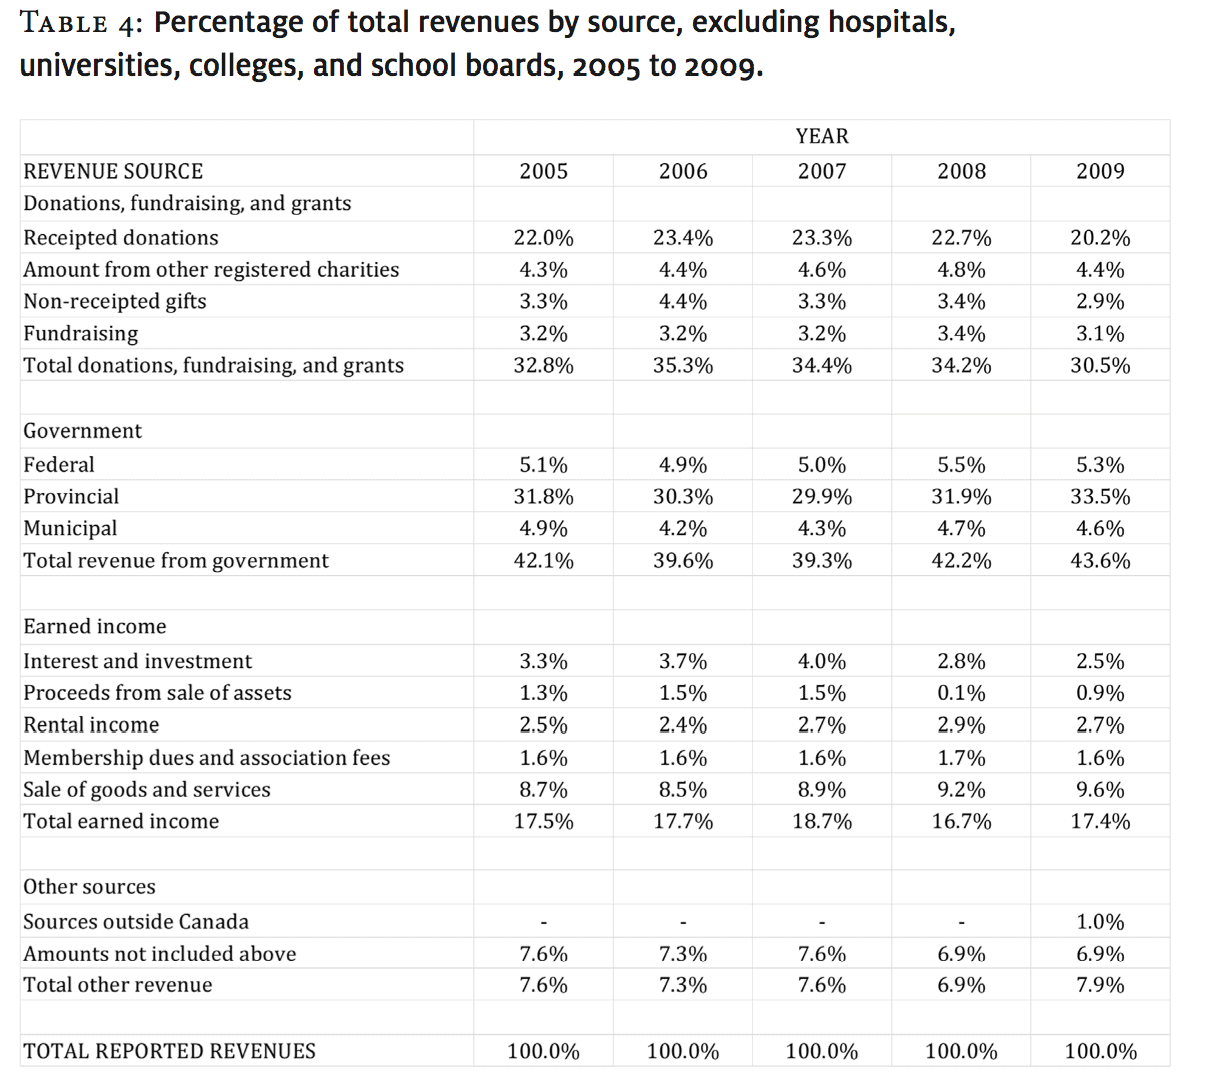
When hospitals, universities, colleges, and school boards are excluded, the picture of sector financing changes noticeably. The role of donations, fundraising, and grants almost triples, with these sources accounting for roughly one third of total revenues (see Table 4). Conversely, the role of government funding is much smaller, accounting for roughly two fifths of total revenues.
Paralleling the pattern seen with donations, the importance of earned income is also somewhat larger, accounting for roughly 17-18% of total revenues.
Although the funding profile changes significantly when hospitals, universities, colleges, and school boards are excluded, similar trends seem to have been at work. For instance, the importance of government funding increased slightly in 2008 and 2009, while the role of donations declined somewhat. Interestingly, although revenue from interest and investments decreased in the last two years for which we had data, the percentage of total revenue from earned income increased.
Table 4: Percentage of total revenues by source, excluding hospitals, universities, colleges, and school boards, 2005 to 2009.
Financing of charities
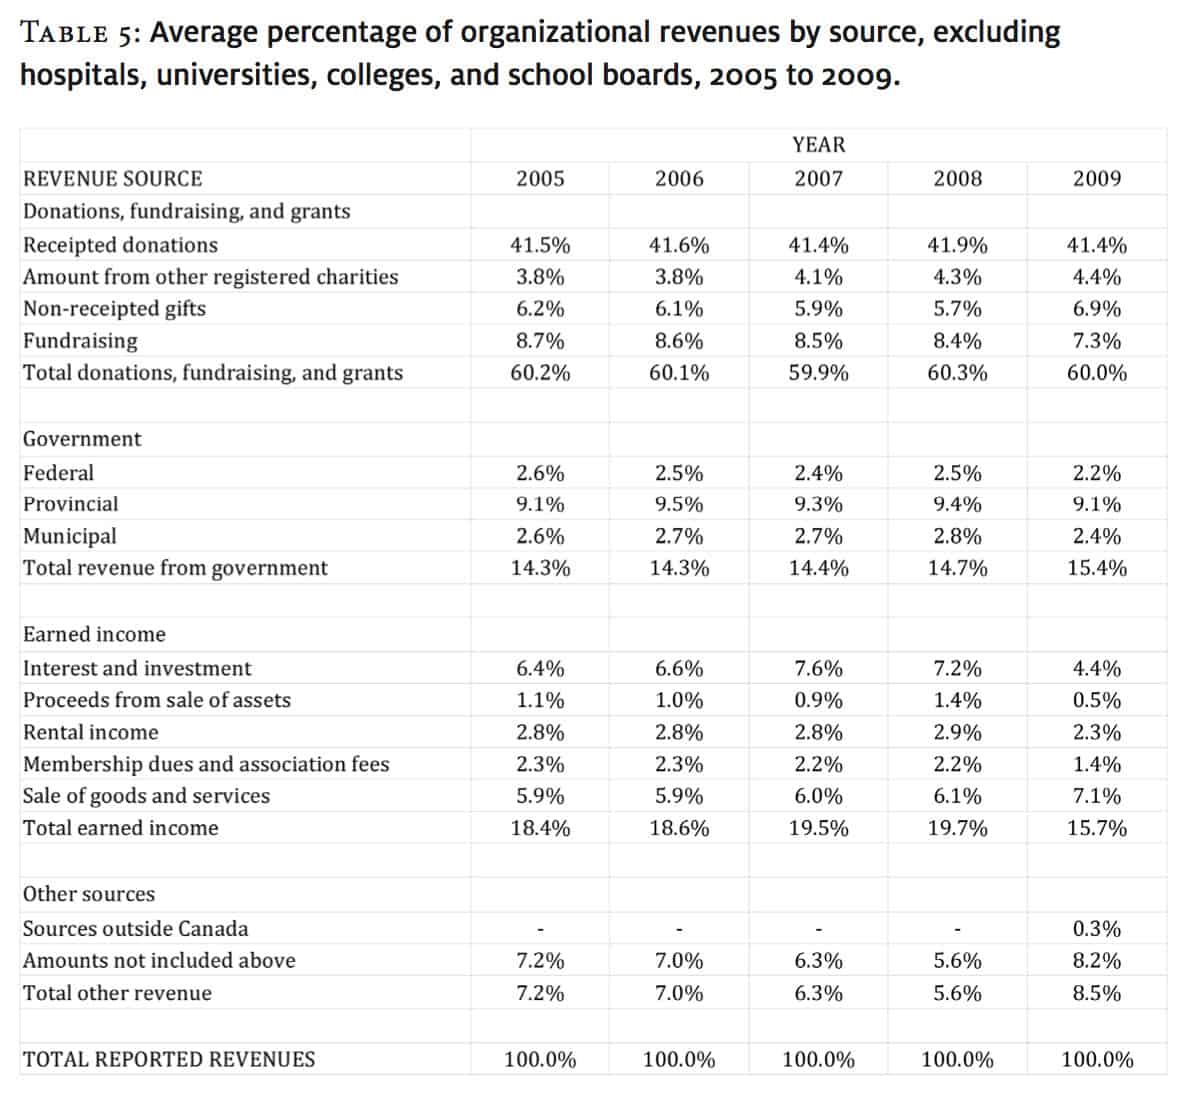
The above analysis focuses on the financing of the charitable sector as a whole. However, T3010 data can also provide considerable insight into how individual charities tend to be financed. Table 5 shows the average percentage of total revenues that comes from each individual source for the “typical” charity (excluding hospitals, universities, colleges, and school boards).4 A comparison of the data in Table 5 with the data in Table 4 tells us that the “typical” charity is much more reliant on donations of all types and much less reliant on government funding than is the core charitable sector as a whole.
Viewed from the perspective of the “typical” individual organization, financing has not changed very much during the period studied. Earned income appears to have grown slightly in importance between 2005 and 2008,driven by increases in interest and investment income. The abrupt drop in this revenue in 2009 is likely driven primarily by changes to the T3010b form for smaller charities, as is the jump in revenue from “other” sources not specifically identified. Government revenue also appears to have increased slightly in importance for the “typical” organization.5 In the main, however, the figures are remarkable for their consistency over time.
Table 5: average percentage of organizational revenues by source, excluding hospitals, universities, colleges, and school boards, 2005 to 2009.
Summary and discussion
The data presented above demonstrate that the picture one has of charity financing depends greatly on where one is standing. The picture presented when one looks at the entire charitable sector is quite different from the picture presented when the small number of charities that are hospitals, universities, colleges, and school boards are excluded. Similarly, the picture looks very different when one views things from the perspective of the “typical” individual charity. In very general terms, if one is more inclusive and stands “farther back,” the perceived role of government funding is much greater and the role of other revenue sources (donations, grants, and earned income) much smaller than when excluding hospitals, universities, colleges, and school boards. Similarly, when viewing things from the perspective of the “typical” organization, the large role played by donations in most organizations becomes much more clearly visible. A central challenge for the sector moving forward is to make it clear to the various stakeholders using T3010 information—who generally take a more inclusive, “farther back” viewpoint—that the picture from their vantage point may not match up with the experience of the organizations and practitioners who make up the sector.
Notes
1. Returns were included in this analysis only when the calculated sum of revenue line items and reported total revenues agreed within 2% or $500, whichever was less.
2. By way of comparison, total reported revenues for all charities went from $153 billion to $192 billion.
3. Note that these figures do not adjust for inflation.
4. The average percentage of total revenues is computed by calculating the percentage of total revenues that comes from each source for each individual organization. These percentages are then averaged across all the organizations included in the analysis.
For example, the average percentage of total revenues coming from donations for a theoretical population of three charities that reported that donations accounted for 100%, 80%, and 0% of total revenues would be 60% (the computation would be as follows (100% + 80% +0%)/3 = 60%).
5. The percentage of revenue from government presented in Table 5 does not agree with the sum of the revenues from each level of government because smaller organizations are not required to report the percentage of funding received from each level of government.
References
Statistics Canada. (n.d.-a). Satellite Account of Non-Profit Institutions and Volunteering:
2007. Last updated December 21, 2009. URL: http://www.statcan.gc.ca/pub/13-015-x/13-015-x2009000-eng.htm [October 28, 2011].
Statistics Canada. (n.d.-b). Table 388-0002: Income and GDP by primary area of activity, nonprofit institutions and volunteering; Canada; Income; Total nonprofit sector; All activity. CANSIM (database). Last updated March 10, 2011.
URL: http://www5.statcan.gc.ca/cansim/a05?id=3880002&stByVal=2&lang=eng
[October 28, 2011].
David Lasby is the Director of Research at Imagine Canada. Email: dlasby@imaginecanada.ca