Introduction
This paper has three objectives: (1) to review what we know about the nature and extent of corporate charitable giving in Canada today, and (2) to discuss the adequacy of existing explanations for these patterns of giving, in order (3) to develop an agenda for future research. This review will deal primarily with publicly owned business corporations (as opposed to individually owned and governmental organizations) in the following analytic framework:
a) Section A will examine actual donations behaviour, i.e., how much is actually given and to whom;
b) Section B begins the examination of why behaviour patterns are as they are by looking at underlying motives, attitudes and values that predispose people or organizations to act as they do;
c) Section C extends the analysis further by examining a variety of factors which may, directly or indirectly, influence the propensity to give and/or the connection between the predisposition to be charitable and the actual act of giving.
This analytical framework is illustrated in Figure 1, p. 44.
A Donations Behaviour refers to the end result of giving and can be described in terms of the answers to two questions: (a) how much do companies donate to charity per year and what are the trends in donations and (b) how are donations distributed (who are the recipients and how much do they receive) and what are the trends in distribution patterns?
This article was developed from a presentation to the 1989 Annual Conference on Philanthropy of The Canadian Centre for Philanthropy in Toronto. It provides further insight into the factors affecting corporate philanthropy in Canada which were outlined by Allan Arlctt in “Corporate Giving: Why Non-Profits Are Vulnerable” (1989), 8 Philanthrop. No.4, p. 3-16.
FIGURE 1
A Framework for the Analysis of Donations Behaviour
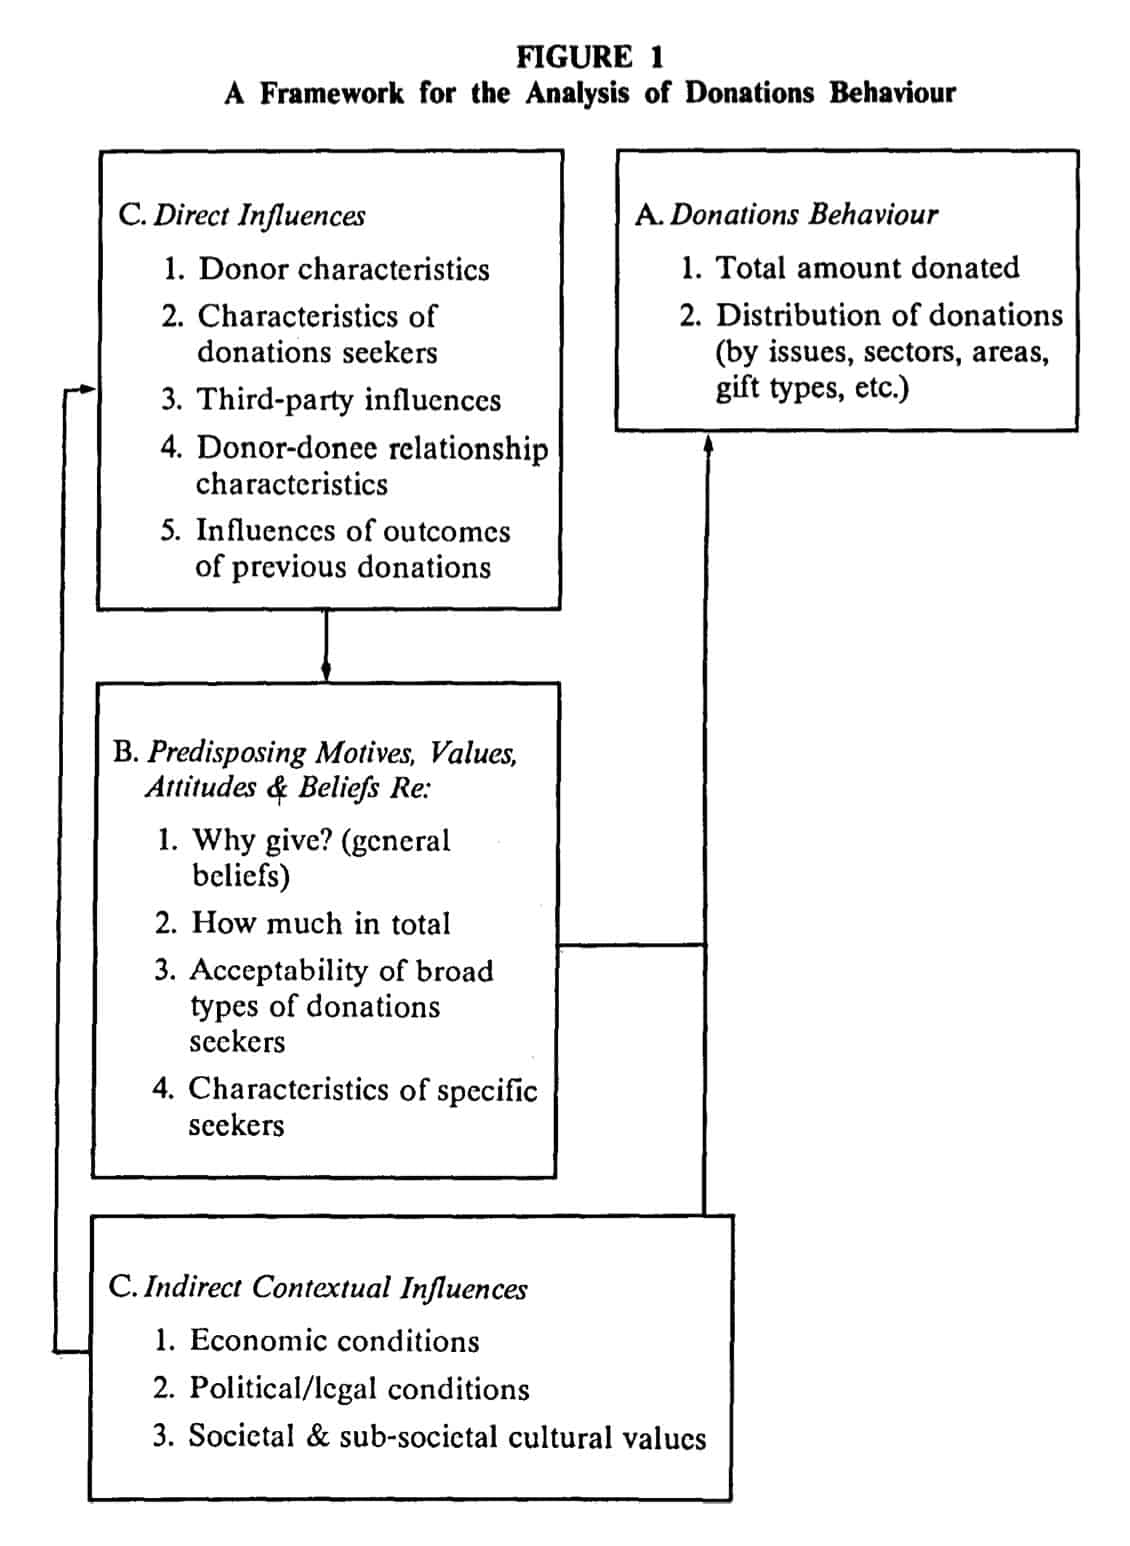 B. Predisposing Motives, Values, Attitudes and Beliefs refers to the cognitive dimension of donations behaviour. It is derived from that branch of psychology which holds that people do not act without some prior propensity in their minds to do so. This predisposition may not always result in overt behaviour because certain external constraints may prevent it (e.g., someone may be strongly inclined to give money to a given donation seeker but may not do so because there is no money to give).
Nevertheless, it is asserted here that a thorough understanding of donations behaviour cannot be achieved without understanding the cognitive process behind the decision to give. Furthermore, this predisposition is not one dimensional. There are potentially a number of attitudes, values, etc. that could affect the act of giving. Among the more important of these are:
a) A basic “philosophical position” on the question (why give anything to anybody?);
b) Beliefs about the total proportion of the firm’s assets which it should give away (the “total pot” decision);
c) A series of attitudes having to do with the acceptability of broad classes of donation seekers and fund-raising appeals. Included here are attitudes toward general approaches to deciding on donations such as the extent to which companies should plan a donations program and whether to focus donations by making fewer and larger (rather than many and smaller) gifts;
d) Attitudes and beliefs about specific donation-seeking organizations and their campaigns.
These clusters of predispositional variables act as “decision rules” which guide the donor toward certain fund seekers or exclude others from consideration.
C. Direct and Indirect Influences. Given certain cognitive predispositions, the next question is: what shapes and changes them? The framework in Figure 1 suggests two sets of factors: those that act directly on them and those that form a context for the whole donations process. Direct influences can be categorized as those influences that pertain to the donor, e.g., age, education, etc.; those that pertain to the donation seeker, e.g., its mission, membership composition, etc.; influences from “third parties” who are able to persuade the donor to support one recipient or another; aspects of the relationship between donor and recipient, e.g., the duration, depth and frequency of contact, etc.; and the influence of the outcomes of previous donation activities, i.e., the extent to which they brought satisfaction to the donor. Indirect or contextual influences refer to general conditions in society that can determine the state of the direct factors or act as constraints on the link between cognitive predispositions and actions. For example, economic conditions affect the availability of resources for donations; the actions of governments affect the needs of donations seekers; tax laws can act as incentives or disincentives to giving; and the general cultural values of society (or sub-groups in society) having to do with the desirability of making donations and the worthiness of various donations seekers can easily be internalized as personal values.
Because of space constraints, the discussion which follows cannot provide a complete overview of all available literature on each issue. Therefore only a representative sample of the most recent research is presented, with a primary emphasis on Canadian data.
A. Donation Behaviour
What we know
1. Total Pot
The most recent and complete information on corporate donations in Canada is that gathered from special analyses done by Statistics Canada for The Canadian Centre for Philanthropy in support of the IMAGINE Campaign. In understanding these data two points are important:
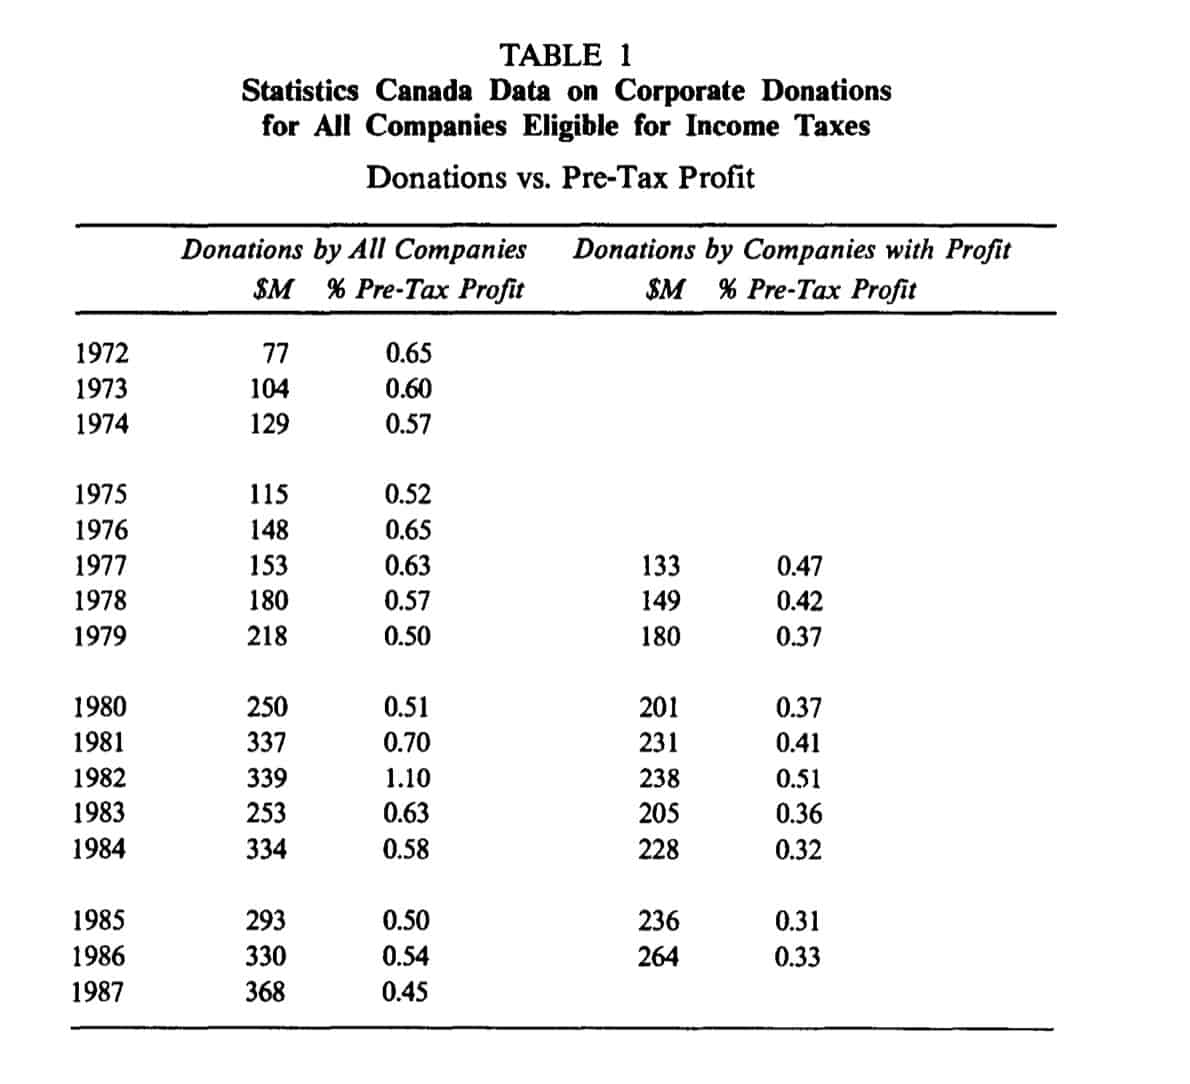
* The donations shown in Table 1 (page 47) are those reported as charged against income on the shareholder accounts and are not regularly published. In Catalogue 61-208, Statistics Canada shows annually the donations allowed as deductions from taxable income, an amount that is consistently 20 per cent to 30 per cent lower than the donations booked.
• It is common for major companies to have a number of wholly owned subsidiaries and every one of them must file a tax return. Statistics Canada does not consolidate these returns under the parent company. As a result, it is misleading to draw firm conclusions about the number or percentage of companies behaving in any particular way.
Given these caveats, Table 1 shows the time series of total corporate donations in Canada and the trends in relation to book profit before corporate income taxes. Donations grew to $368 million in 1987 but there is a negative trend in giving as a percentage of pre-tax profit-from over one per cent around 1960, giving fell to 0.45 per cent of pre-tax profit in
1987. Note, too, that donations were stable in 1982, a year of dramatic reduction in profits but that they fell in the next year. This reflects the usual pattern of corporate donations budgeting: it tends to follow previous years’ profits and is heavily committed in advance.
2. Distribution of Donations
The primary sources of data on the ways that Canadian corporations distribute their donations among the various donation seekers are the 1988 survey of donations practices carried out by Decima Research for the IMAGINE Campaign; the annual report on corporate giving published by the Institute of Donations and Public Affairs Research (IDPAR); and data collected by Dr. Victor Murray from a sample of 34 Canadian and 11 American “leading givers” in 1988 as part of a study sponsored by the Ford Motor Company Limited. These data appear in Tables 2, 3, and 4 (pp. 48, 49, 50).
TABLE 2
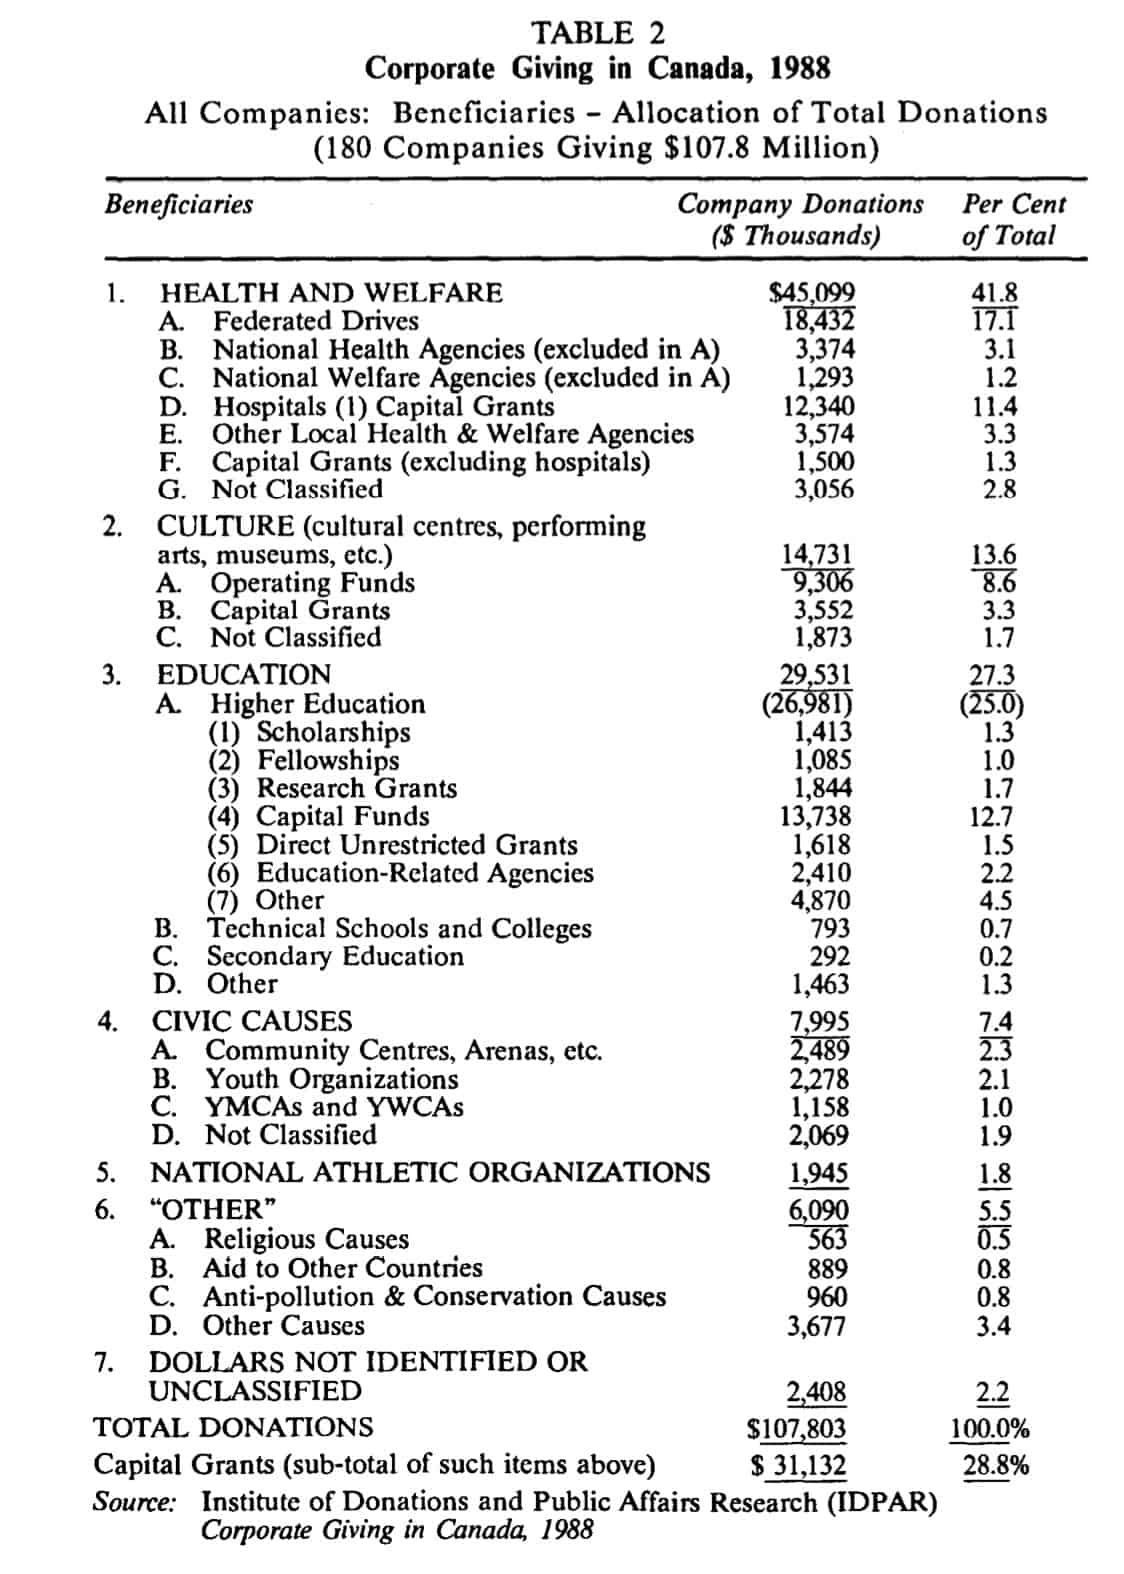
The IDPAR data (Table 2) show the most detailed breakdown of giving in 1988 as reported by 180 of IDPAR’s member organizations which are primarily large publicly owned corporations. For example, Table 2 shows that Health and Welfare is the most heavily supported sector (42 per cent of donations dollars) followed by Education (27 per cent) and Culture (14 per cent).
By way of contrast, the Decima data were based on reports of businesses as to the frequency with which they gave to various sectors using slightly different categories. Overall, Health heads the list followed by Education and Welfare. Community Organizations rank fourth followed by the Recreation and Culture sectors. Note, however, the considerable difference between the allocation patterns of large and those of small organizations. These will be discussed in part C.
Finally, the Ford study data confirm the dominance of Health and Education as recipients for donations from large corporations. These data separate out United Appeal and similar Federated Campaigns showing them as the third most supported sector followed by Culture and Civic Organizations. Non-United-Way Welfare Organizations rank fifth and Recreation last
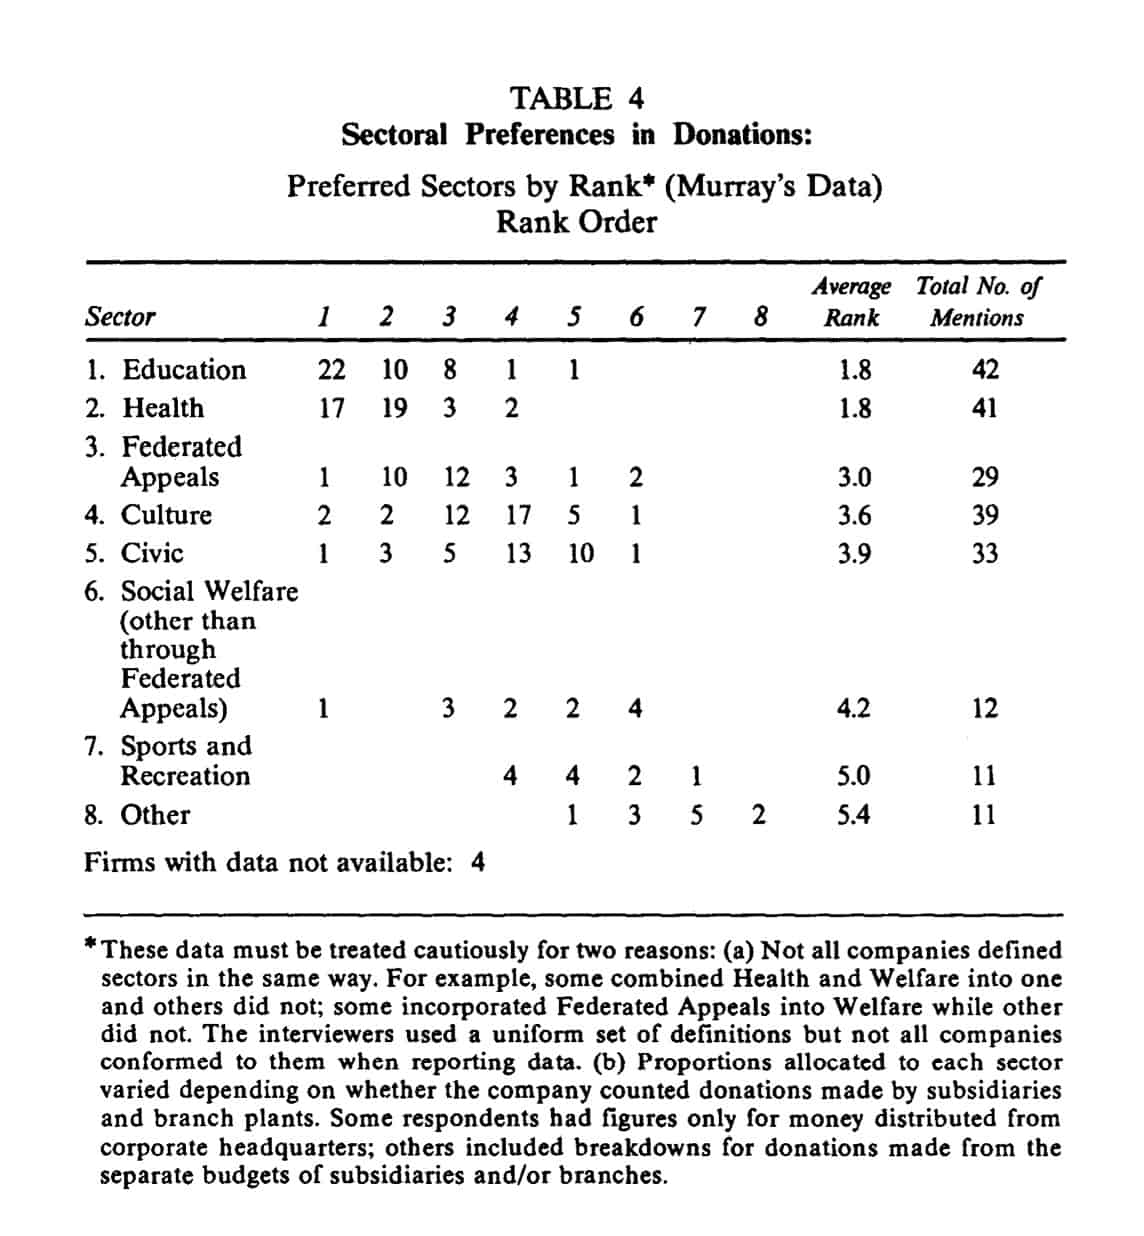
These data must be treated cautiously for two reasons: {a) Not all companies defined sectors in the same way. For example, some combined Health and Welfare into one and others did not; some incorporated Federated Appeals into Welfare while other did not. The interviewers used a uniform set of definitions but not all companies conformed to them when reporting data. {b) Proportions allocated to each sector varied depending on whether the company counted donations made by subsidiaries and branch plants. Some respondents had figures only for money distributed from corporate headquarters; others included breakdowns for donations made from the separate budgets of subsidiaries and/or branches.
What we don’t know
The main gaps in knowledge about the actual donation behaviour of
Canadian corporations are of two types:
a) Those which arise because the Statistics Canada data are not consolidated under the company of ownership or control. At the present time we are unable with any assurance to examine what percentage of companies behaves in any particular way. It would be most useful to see, for example, a frequency distribution of the giving of total enterprises in relation to their overall profits.
b) In the area of distribution there is lack of agreement on the definition of sectors among donation seekers which makes it difficult to compare data from different sources; there is very little information on trends in donation distributions; and almost no data that reveal patterns of donation beyond the sector level.
In particular, it would be useful to know how corporate donations are distributed by issue, by geographic area, and by type of gift. The only data pertaining to the last category is that gathered by IDPAR showing 28.8 per cent of 1988 corporate donations going to capital campaigns. Of equal interest, however, is the growing phenomenon of the sponsorship of special events held by charitable organizations. Some of these are supported from donations budgets, others from sales promotion budgets. Though there is much talk about the growth of this form of”support” and discussion of the pros and cons of it, there is a strikingly small amount of data on its nature and extent.
B. Corporate Donations Policies and Plans
In the corporate world, the same motives, values, etc. exist as can be found in the minds of individual donors but they are in the minds of the company officials whose responsibility it is to make the critical decisions on donations. However, unlike most individual donors, corporations usually develop traditions of practice which take the form of written or unwritten guidelines which executives approving donations are expected to follow from one year to another. When such guidelines are written down they become official policies; when they are debated beforehand and changed in response to circumstances, they become plans. Not every firm has policies or plans regarding donations but most have an informal history of past practice which guides their behaviour in any given year. While the relationship between past practice, policies, plans, and individual motives and values is complex and far from clear, we will nevertheless, for the sake of simplicity, treat them as analogous here, i.e., as a set of cognitive predispositions which precede the act of donating.
General Value Orientations or Meta Strategies On Donations
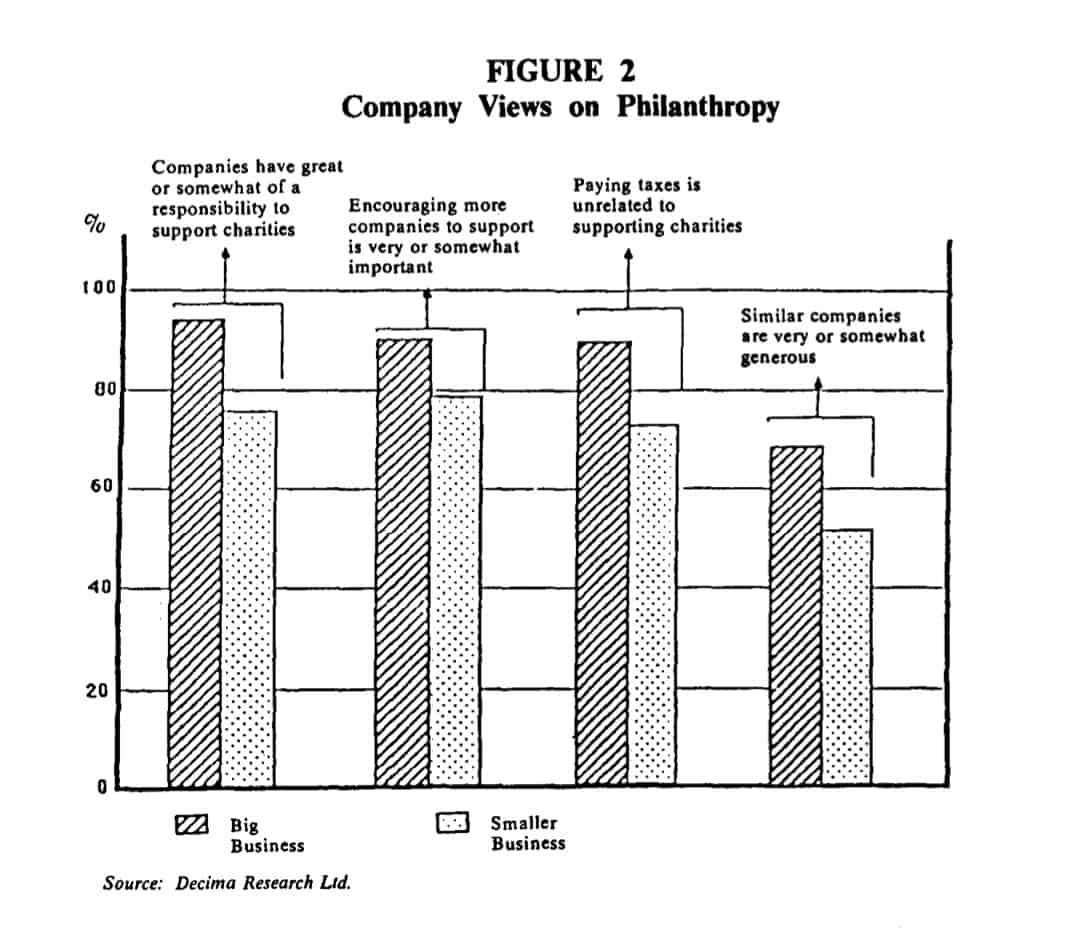
Recent Canadian data on overall attitudes among corporate givers are available from the Decima Survey for the IMAGINE Campaign. Figure 2 (page 52) shows the responses of larger and smaller respondents to four general questions on philanthropy. It can be seen that the vast majority of the companies surveyed believe business has a responsibility to support charities; approve of encouraging more support for charitable giving; and claim that tax incentives are not a major consideration in determining their support of charities. Like individual givers, however, there was a majority of respondents who also believe that companies like themselves are already very, or somewhat, generous in their giving.
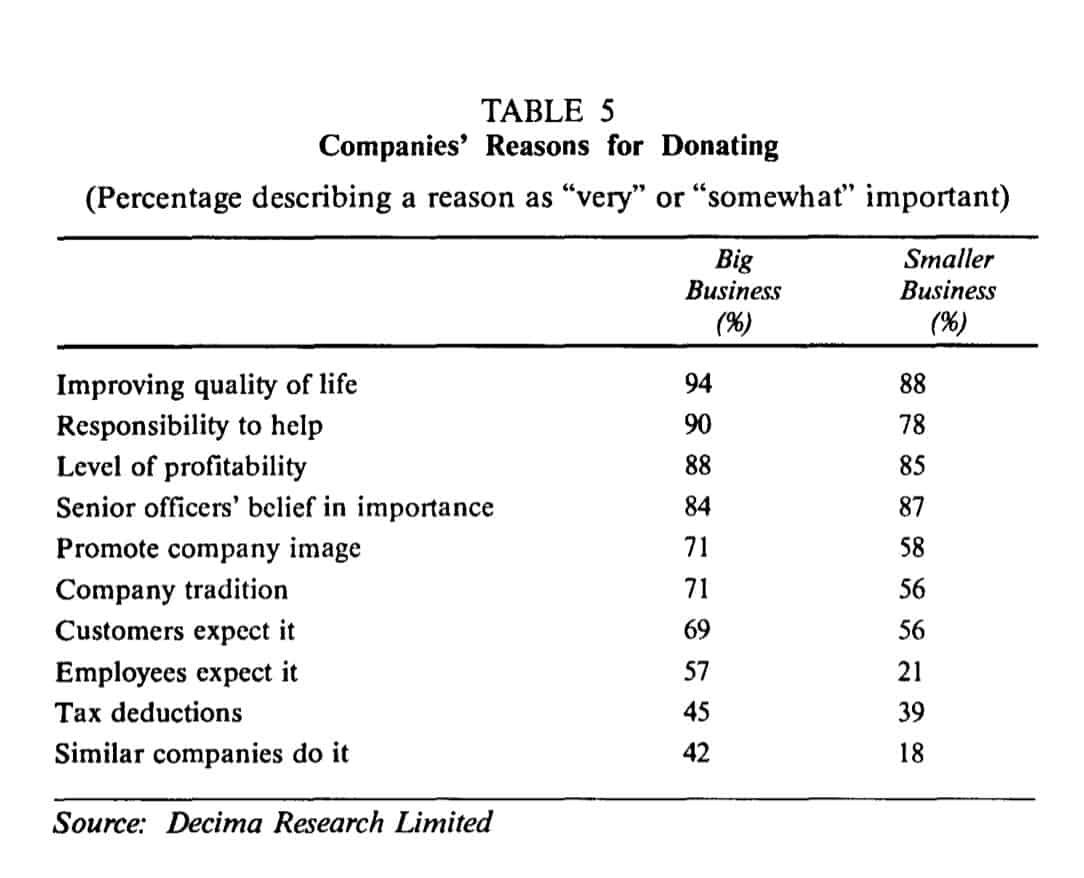
A more specific look at why business leaders say that they make donations is presented in Table 5 (page 53). The four top reasons predominate and are the same for both large and smaller companies. They indicate acceptance of responsibility for helping achieve or maintain a good quality of life in the community provided there is a level of profitability which the company believes enables it to afford to do so. The lower six reasons are less altruistic and to different degrees reflect a need to conform to the patterns of the past or other pressures.
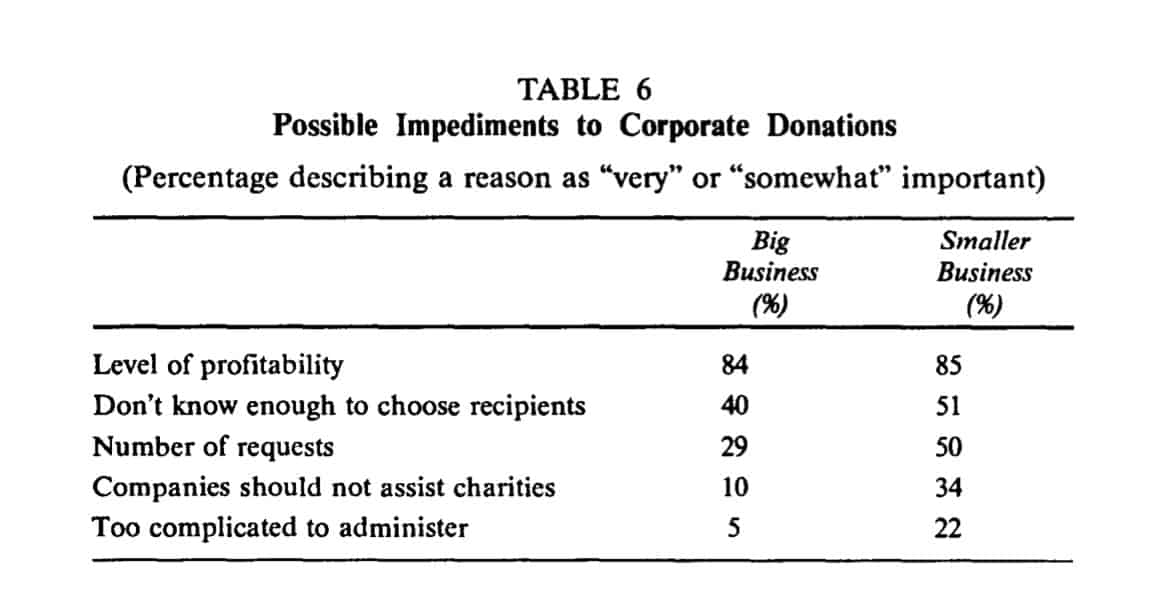
By contrast, from Table 6 (page 54), we can see some of the reasons companies give for not making charitable donations. The overwhelming reason is level of profitability. All but one of the remaining reasons cited reflect the companies’ state of readiness to be donors-not knowing enough about the donation seekers, being overwhelmed by the number of requests, and not being set up to administer a donations program are all remediable conditions. It is important to note that only 10 per cent of the large companies but as high as 34 per cent of the smaller ones subscribed to the philosophical position that business should not, on principle, make charitable donations.
The previously mentioned (as yet unpublished) Murray/Ford study of the donations practices of 46 large corporations in the United States and Canada, carried out in-depth interviews that attempted to probe beneath the publicly expressed attitudes on philanthropy. It concludes that there are three basic values at work which shape many of the specific decisions on donations:
1. Social-responsibility values are a cluster of beliefs around the idea that donations should be made because they benefit society in general and thereby, in the long run, the general climate for all businesses will be better.
2. Business-related values view donations as being good for a particular business (not just business in general) in the shorter term (not in some indeterminate long time). The essence of the difference between the two sets of values is the directness and immediacy of the benefits to be derived from making donations.
3. The third position holds that donations are simply a necessary condition for doing business. While the first two orientations see donations as bringing a positive benefit of one kind or another, this residual value is based on the belief that a business “has to” give because important stakeholders in the business might do it harm if certain donations were not made. The primary aim of this third value, however, is to spend as little time, effort, and money as possible while avoiding “hassle” from others.
Murray argues that these three value positions are independent of each other so that all three may be represented within a given company and even, to some extent, within a given decision maker. One can thus only talk about their relative dominance. For example, 28 per cent of the firms studied were judged to have a “maximum do-good” orientation in which social responsibility was felt to dominate other concerns. Conversely, 22 per cent had a “maximum image-impact” orientation dominated by business-related values. Another nine per cent were dominated by convenience values while the remainder of the organizations revealed mixed patterns. For example, 28 per cent showed no clear dominance of any of the three orientations and 13 per cent showed a mixture of social responsibility and business values with one slightly dominant.
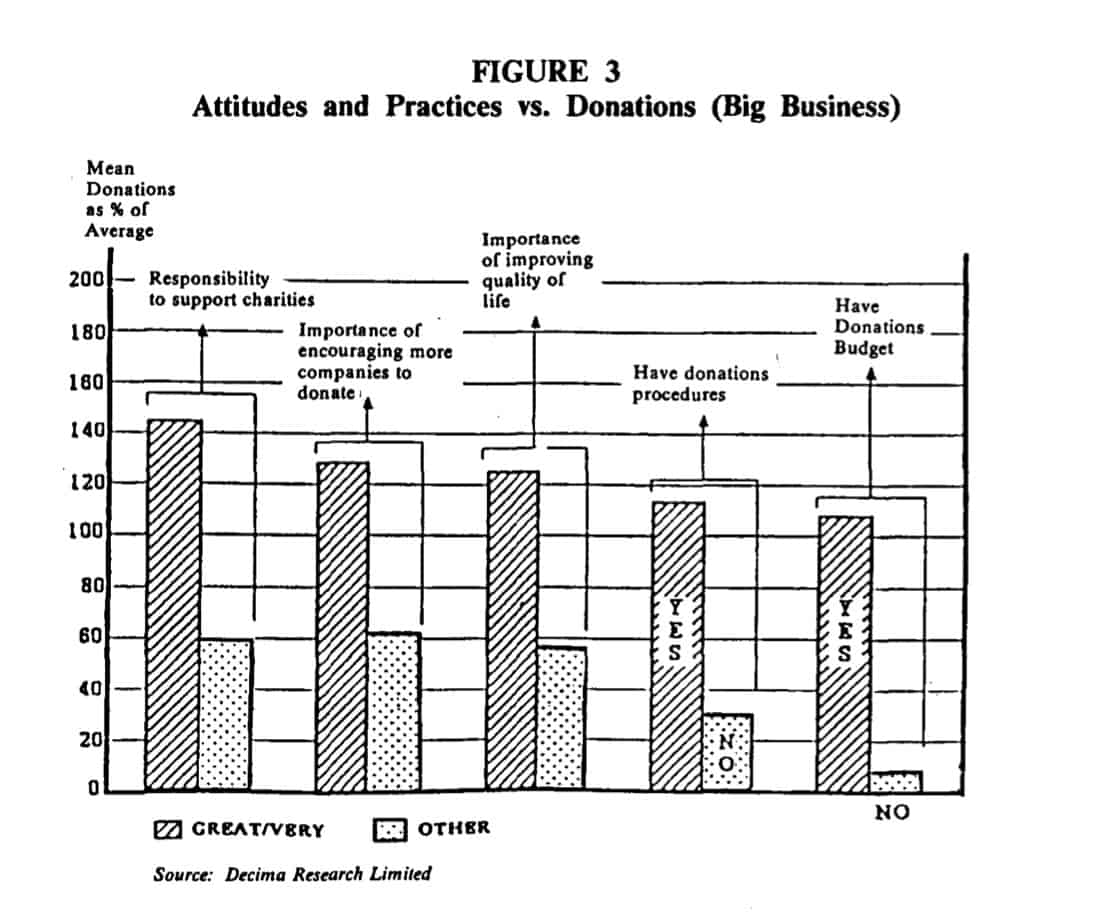
Attitudes and Behaviour
This discussion of general attitudes to philanthropy is predicated on the hypothesis that attitudes predispose the decision maker to action so that a belief in the value of making donations will actually lead to donations being made. Unfortunately, there are rather few tests of this hypothesis. One of the few that exist in Canada has been carried out by the Decima Survey discussed above. It can be seen from Figure 3 (above) that the hypothesis is, in fact, supported in large companies. For instance, companies who say they have a great responsibility to help charitable organizations donated 145 per cent of the average level. In comparison, those feeling a lesser degree of such responsibility donated only 60 per cent of the average level. Similar patterns were also found among smaller businesses in this survey.
Other Values and Policies Relevant to Donations Behaviour
Decisions related to the Total Pot.The decision on how much in total to give to donation seekers can be strongly affected by the company’s official or unofficial position with respect to several criteria. For example, how important is it to tie the size of the donations budget to the profitability of the firm? While the correlation in fact is a close one, it is not one-to-one, which indicates that some firms will maintain donation levels when profits decline and others will not increase donations as profits grow. Another question is: how important is it to relate the amount given to what other companies give and, if so, what companies and in what proportion?
The total-pot decision can also be affected by a general belief as to what the decision makers feel is a “fair share” for companies like their own to give, and their perceptions of what the charitable organizations they want to assist actually need in the way of corporate support. These are judgments that rest largely on highly subjective beliefs and perceptions.
In Murray’s study, at least 10 of the 46 firms interviewed reported that donations budgets remained at the same level during periods of profit decline and another 10 reported that their donation budgets did not increase proportionately to profit increase, thus suggesting that economic performance is not the only factor shaping the size of the donations budget.
Murray also reports that half the firms studied were influenced in budget setting by information as to what other companies gave but there is no uniformity in the choice of figures for comparison. Some use community norms, some industry norms, and some the norms of organizations of comparable size. The fact is that such comparative data are not readily available so comparisons are largely based on subjective impressions.
Companies with high social-responsibility values also had a willingness to subscribe to the belief that a certain percentage of before-tax profits (usually one per cent) could fairly be expected by society as donations from the corporate sector. Others in this category also say they are willing to consider what certain important recipients claim to be their financial needs, e.g., United Way quotas for corporate donors, university capital campaign goals, etc.
Finally, it should be noted that the donations budget can be affected substantially by the way that businesses choose to define certain key concepts. For example: what is a donation and what is a business expense? In this era of “social marketing”, the distinction becomes less and less clear. In Murray’s study, for example, most firms made subjective decisions about how to allocate money between donations and business promotion accounts on the basis of the costs involved and the marketing potential provided by the event or project to be sponsored. The higher the cost and the greater the promotional potential, the more likely it was that the money spent would not be counted as a donation. A few firms went so far as to make a blanket decision that all special event sponsorships would be handled by marketing specialists.
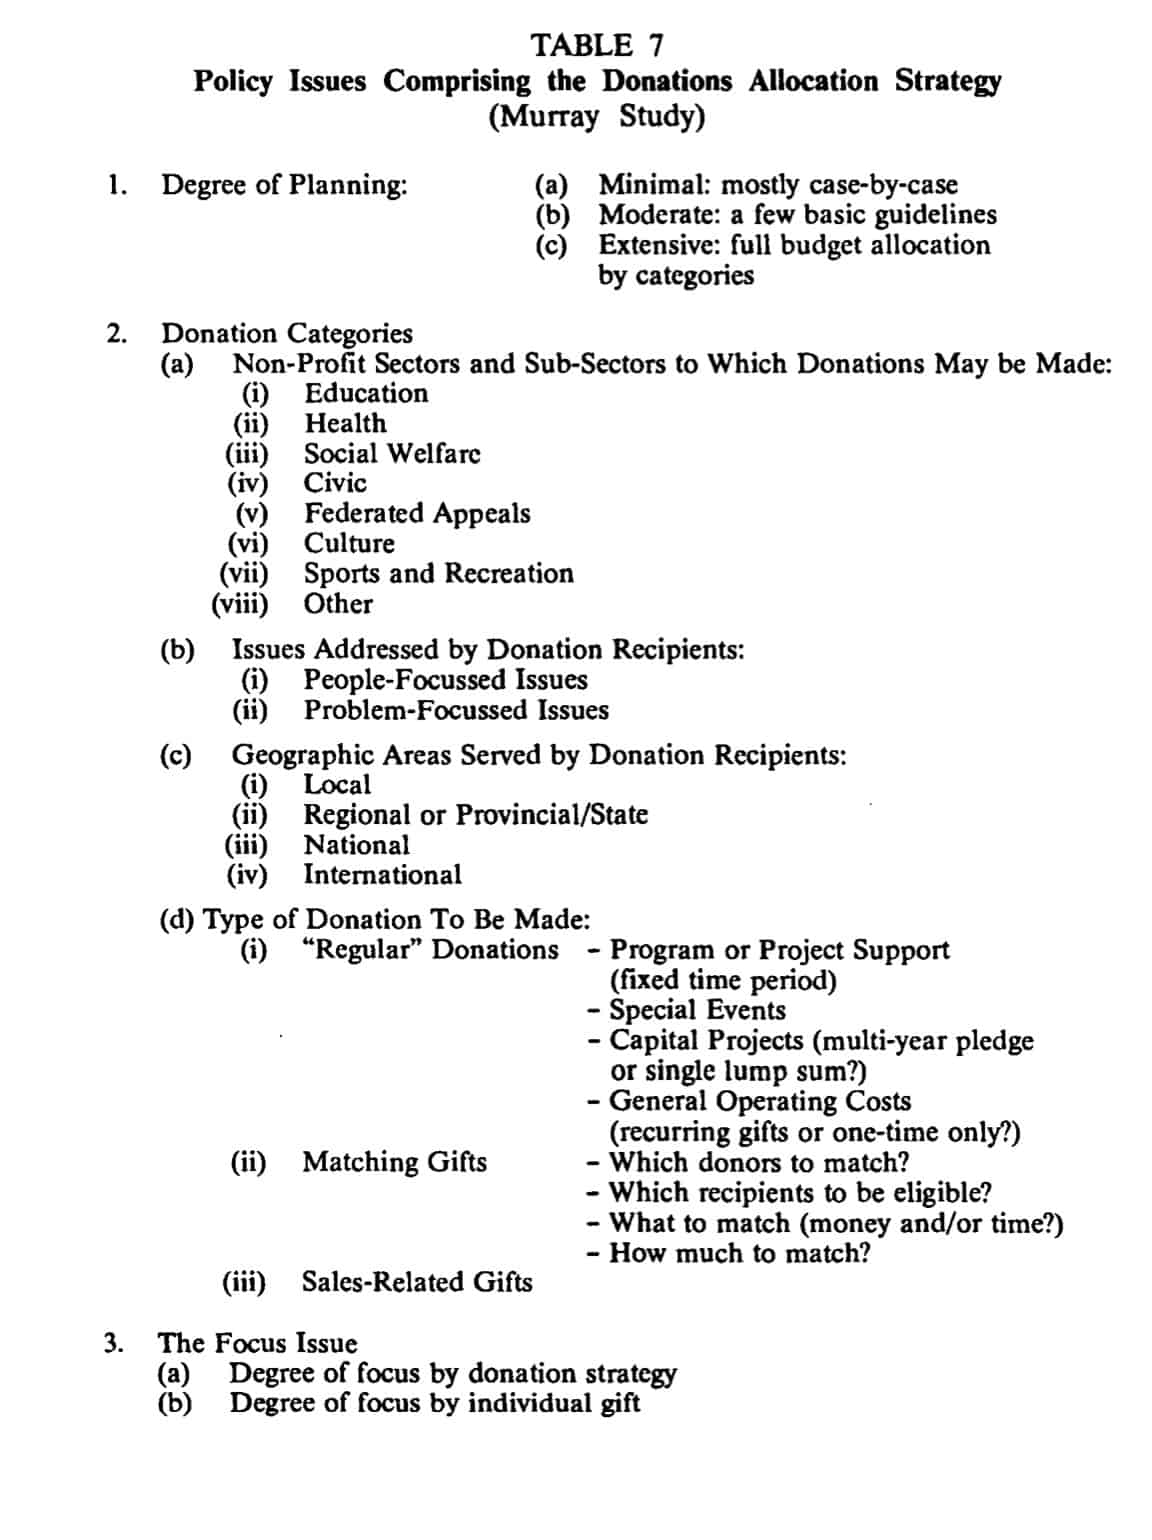
Decisions Related to Distribution. There are many policy choices which companies may make which shape the distribution pattern of their donations. (Table 7, page 58). First, a company can choose whether to develop any policies or plans at all to guide decisions on donation requests; secondly, it can decide to what extent, if at all, it wishes to focus its donations by giving only to certain types of charities or only to a few specific organizations. Thirdly, given a desire to plan and focus to some extent (as opposed to purely ad hoc giving), it can choose to emphasize donations in various categories. Four broad categories of “guideline and exclusion” policies are identified in Table 7: sectors, issues, geographic areas and types of donation.
Space limitations prohibit a detailed discussion of the fmdings in Murray’s exploratory study of the actual policies of the firms studied. Suffice it to say here that detailed strategic plans for allocating donation money are still not all that common in large Canadian corporations though the trend is toward developing more formal plans and policies.
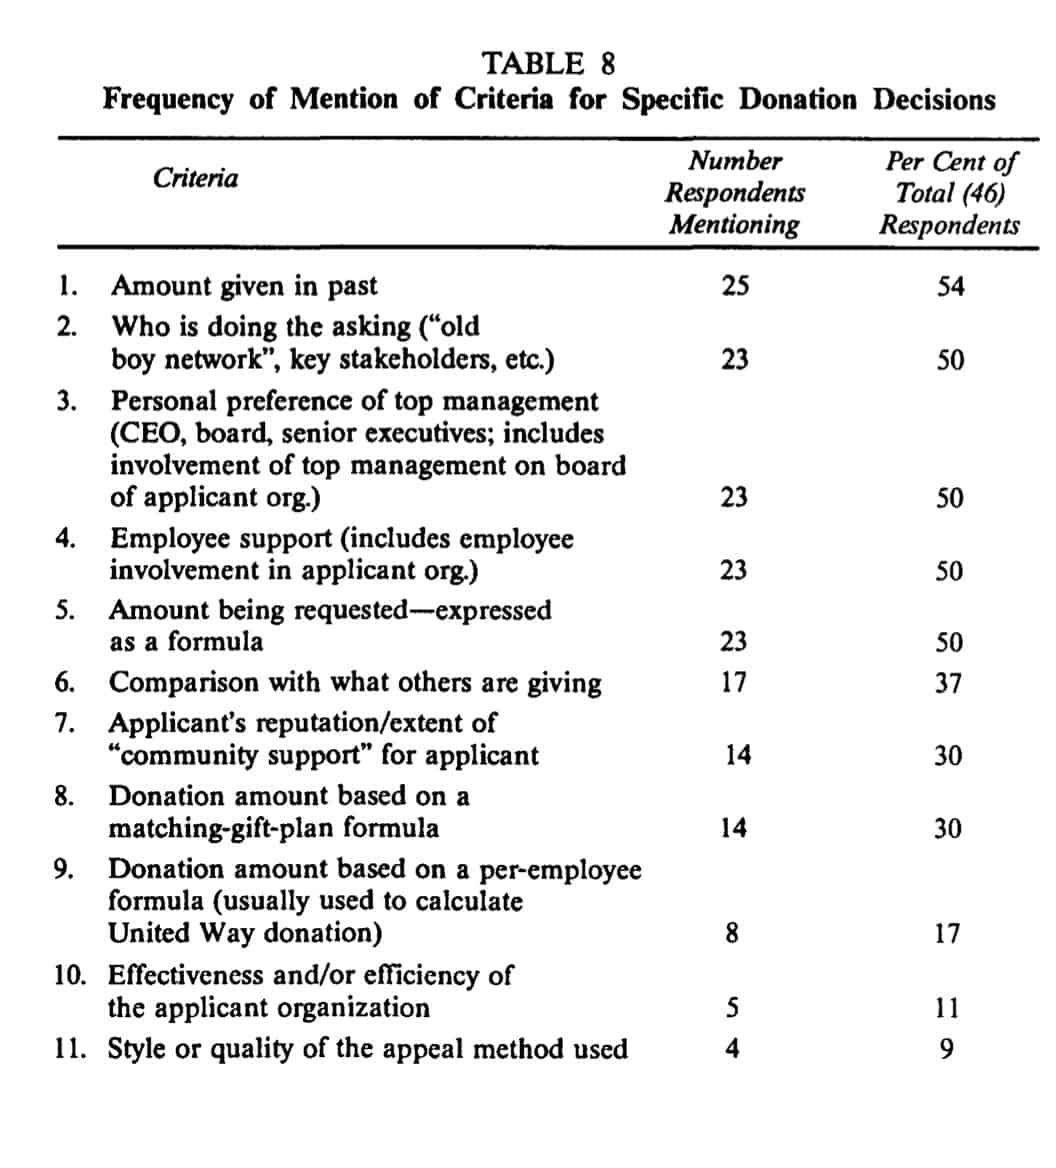
Decisions Related to Specific Donations. The allocation guidelines discussed above merely help a company to whittle down thousands of requests for donations to a manageable number. Once this is done, however, it is still necessary to choose who among the eligible pool will receive a donation and for how much. This decision may be influenced by an additional set of attitudes, values and beliefs that help the firm differentiate among applicants. The criteria which Murray found to be in use to varying degrees are shown in Table 8 (page 59). It can be seen that past practice with respect to any given applicant is the most commonly mentioned criterion (54 per cent). At least half the sample also mentioned the prestige or importance of the person making the request, the personal preferences of top management, and a subjective judgment as to how much the company’s employees supported the applicant. Again, more detailed discussion of these results can be found in the Murray/Ford study.
What we don’t know
Murray’s study is just a start on the job of uncovering the many aspects of corporate donations decision making. Much remains to be done to test the value of the particular set of decision criteria he identifies and to gather data on the nature and extent of their use in a larger sample of organizations. It is particularly important to examine the relationship between these policy issues and actual donations behaviour and, in turn, to look at the relationship between specific policies and the nature of the meta-strategic values held by the company’s top decision makers. Similarly, longitudinal studies of the process that leads to the adoption or change of donation allocation policies and their related beliefs and attitudes would be of immense value.
What we know
By far the greatest amount of analytic research on corporate donations practices is American and examines the impact of donor and donee organizations on total amounts donated. Much less is available on their impact on policy decisions or on allocation patterns. There is also less information available regarding the situation in Canada, though the Decima Study does consider a few of the relevant variables. However, only the Canadian data will be discussed at this time.
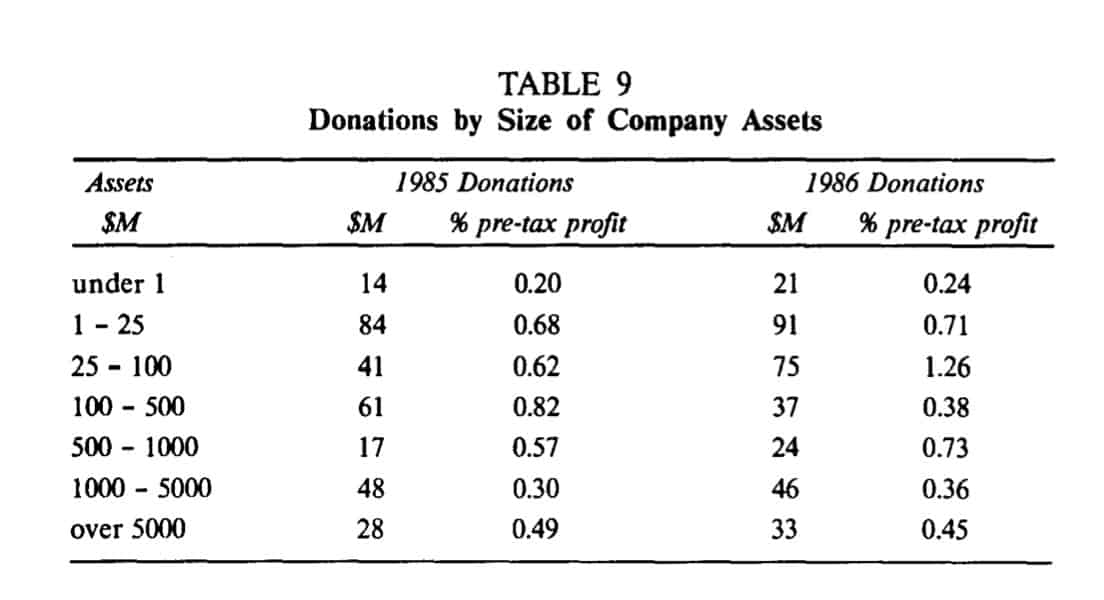
a) Donor Characteristics. Two of the most significant influences on corporate donations behaviour appear to be the size of the organization and its industry category. Tables 9 and 10 from The Canadian Centre for Philanthropy’s study on corporate donations show their impact For the two years 1985 and 1986, donations as a percentage of pre-tax profits varied from a low of .20 to 1.26 among companies with different sized assets. However, if we discount the smallest group because they are largely individual proprietors, the other groups show a slight decline in donations related to profits as assets increase.
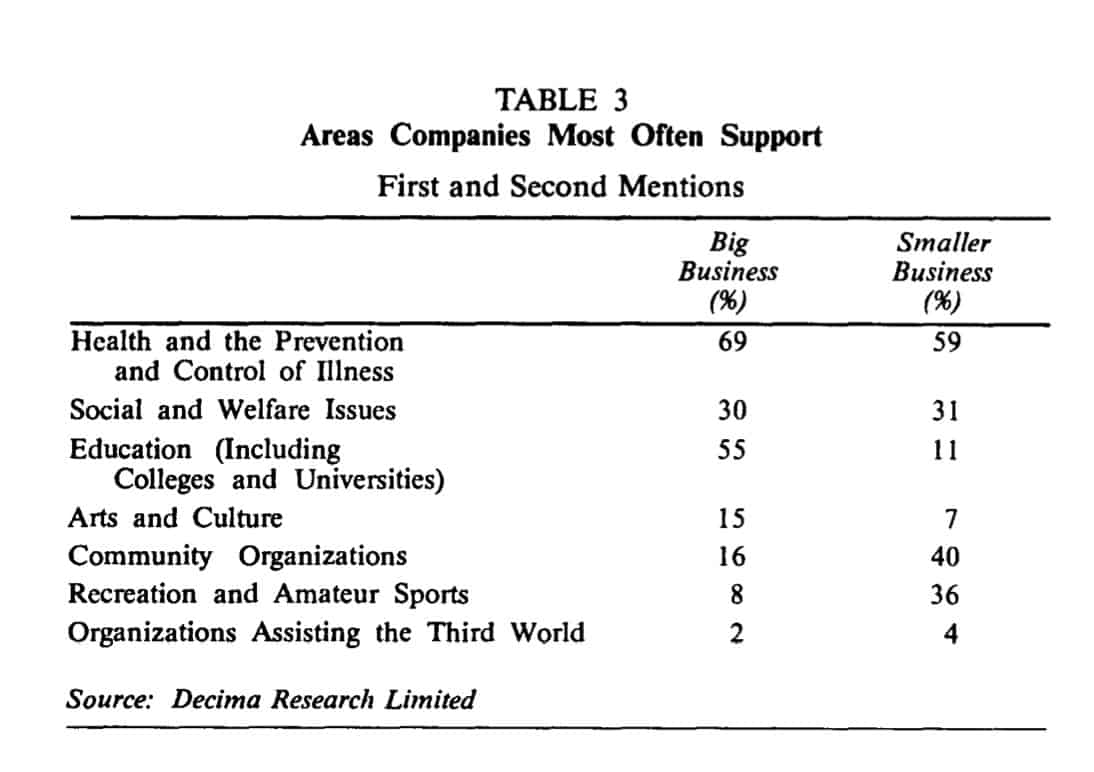
Size would appear to have a clearer impact on the allocation of donations (as was revealed in Table 3). Here it can be seen that larger businesses are more likely to give to education and, to a lesser extent, to arts and health-related charities. Smaller businesses are more likely to support local community organizations and recreation and amateur sport activities. This presumably reflects the closer association of smaller businesses with their local communities.
Tables 5 and 6 also show the impact of size on some of the attitudinal variables discussed in Part B. Reviewing reasons for making donations for example (Table 5), larger businesses are more likely than smaller ones to cite an interest in promoting the company image, a company tradition of giving, employee expectations, and a desire to follow the practices of other companies. Conversely, looking at cited reasons for not giving (Table 6), smaller companies are more likely than larger ones to report that they don’t approve in principle of companies giving money to charity (possibly because entrepreneurs may give as individuals). They are also more likely
to cite the large number of requests and the lack of an administrative system for handling them as factors influencing their failure to give.
Related to this finding, The Canadian Centre for Philanthropy research has also revealed that large companies are more likely than smaller ones to have formal policies and procedures for handling donations requests and that those who have them in fact give more and have a variety of other attitudes and beliefs which positively support donations activity no matter what their size.
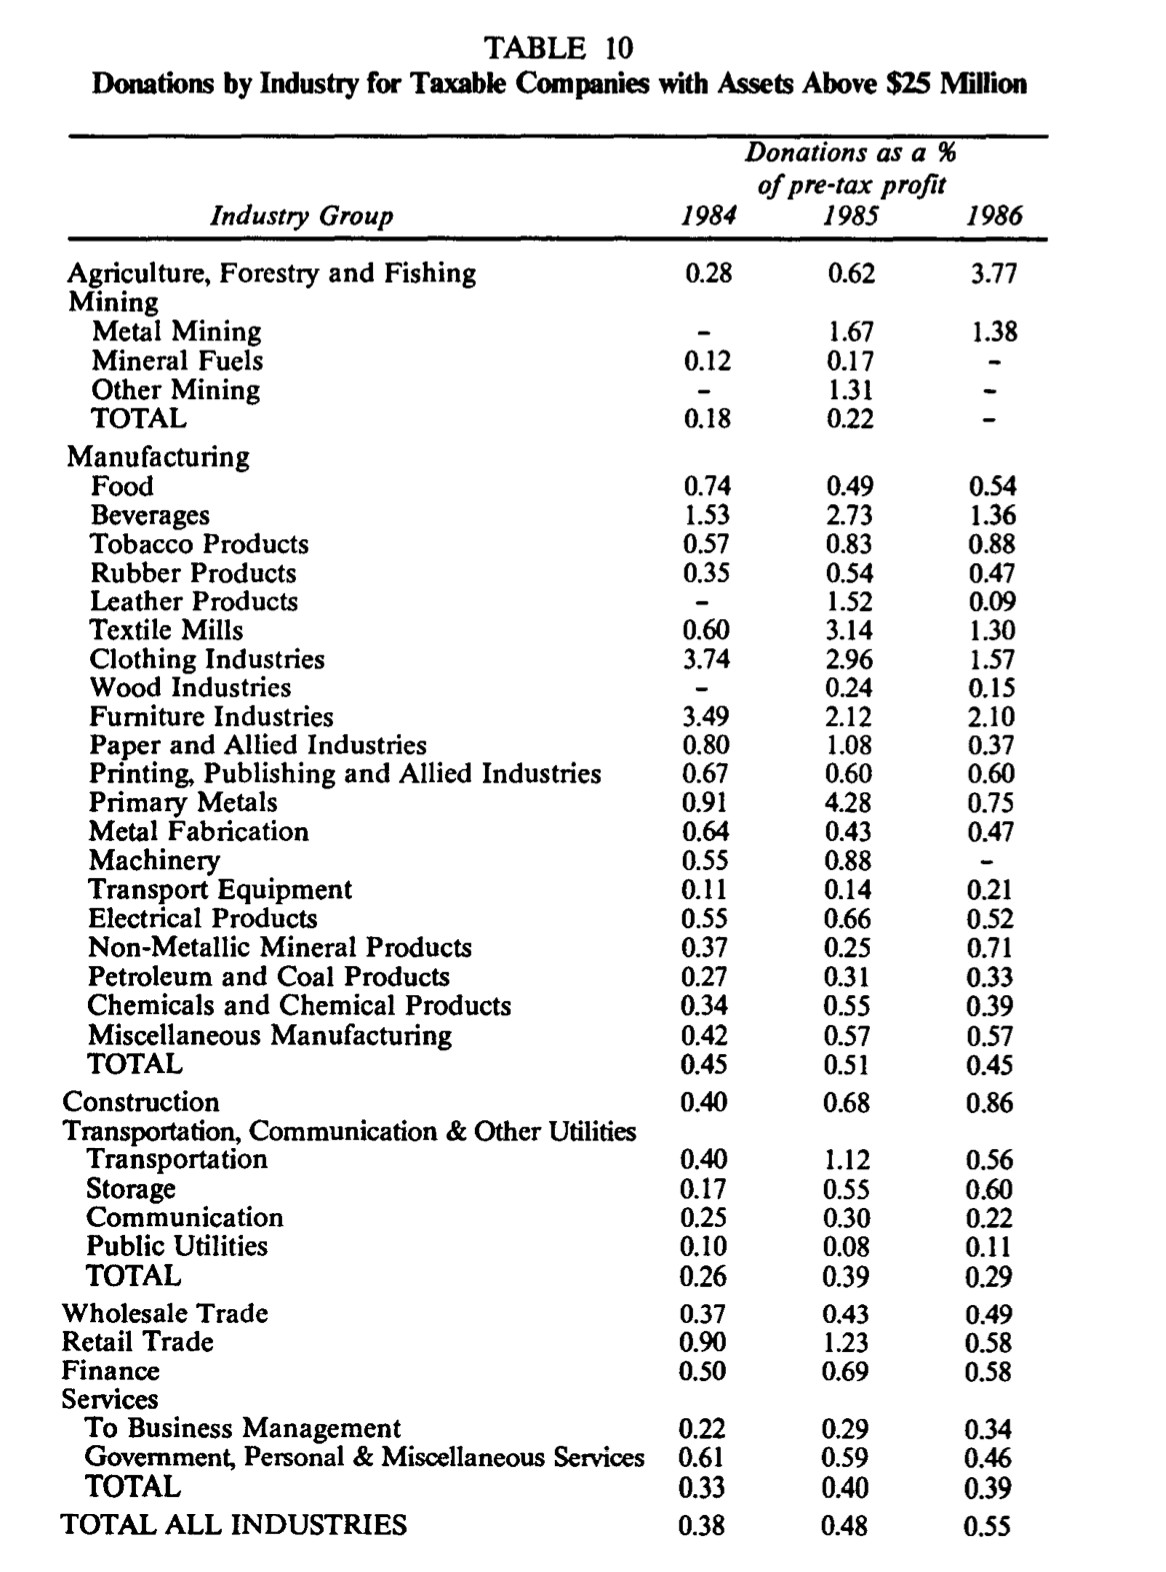
Table 10 {page 61) looks at the impact of industry type on total donations over three years, 1984 to 1986. The four industries with the lowest giving ratio (Mineral Fuels, Wood, Industries, Transport Equipment and Public Utilities) average 0.18 per cent of pre-tax profit in donations. In contrast, the four with the highest giving ratio (Metal Mining, Clothing, Furniture and Machinery) average 2.8 per cent. Unfortunately, the profits of the most generous group are not nearly as large as those of the least generous group so the actual donations are not all that large. We are also at something of a loss for a theory which would explain why those in one industry are likely to be more generous than those in another.
Another variable of interest is the nature of the ownership of a company. According to the Decima research, widely, as opposed to closely, held companies are significantly more likely to: give more, say that tax deductions and the company tradition of giving are not important reasons for giving, and say that they believe Canadian companies are less generous than American companies.
b) Donation-Seeker Characteristics. American researchers such as Galaskiewicz (1985) and Useem (1987) have made important contributions toward showing the relevance of various characteristics of the donationseeking organizations in determining how much money they will get from companies; however similar research has not yet been done in Canada. Using the American research and Murray’s study (see Table 8) as guidelines, we should begin looking at such factors as the size and age of the donation seekers, their prestige in the community, and through whom they make their requests to corporations (prestigious community leaders, professional fund raisers, etc.).
c) Donor-Donee Relationship Characteristics. Again, American research would suggest that the closeness and duration of the relationship between a given donor and recipient would be likely to influence both attitudes and behaviour with respect to giving; however we have no Canadian data.
d) Third-Party Influences. There is much anecdotal evidence of the importance of key power figures in the external environment in influencing the way businesses donate. Community and industry leaders, major customers, government officials and other power figures have all been said to have the ability to “lean on” a company to persuade it to make donations of one kind or another. Systematic research on this phenomenon is not available for Canada.
e) Impact of Previous Donations.Some companies claim that their decisions on how much to give to any particular donation seeker are influenced by their assessment of how well previous donations to that organization were used or how much recognition and image enhancement the company has received as a result of past support. However, studies which establish the actual effects of previous donations on future donations have yet to be done.
f) Indirect Influences. There are small amounts of data on the relationship between donations behaviour and various aspects of the national economic situation, the structure of tax and other laws related to donations, and societal and sub-societal values with respect to giving. Statistics Canada data, for example, have shown that corporate giving is highly correlated with company profits but that it lags behind financial performance by a year. It also appears from Decima’s self-report data from Canadian business leaders that their decisions on donations are not substantially affected by tax laws. However, this remains to be tested more directly. Studies of Canada-wide and regional or other sub-cultures in Canadian society and their impact on corporate donations behaviour have yet to be done in any form.
What we don’t know
It is obvious from this list that much remains to be done to test the relationship between donations behaviour and the vast array of potential independent variables identified as direct and indirect influences. As with individual donations, however, it is even more serious that there is, as yet. no well articulated theory of corporate donations behaviour to guide the research that needs to be done. “Garbage can” studies which use every conceivable variable that the researchers “feel” might influence donations end up being far too cumbersome and complicated to analyze and interpret
Conclusions
This brief overview of corporate donations behaviour in Canada leads to three conclusions about a research agenda:
1. In the realm of simple descriptive data on the behaviour of corporations with respect to how much they give and to whom,
the major needs are for: (a) standardization of the methods of presenting these data to allow for the comparison of studies, and (b) greater emphasis on research into how donations are allocated (as opposed to simply how much money is donated overall).
2. A major gap in the research literature on donations is in the area of motivation. For individuals, this can take the form of investigations of the values, attitudes and beliefs that predispose a person to action. For corporations, it can involve studying these same individual attributes among key decision makers and the formal policies or informal culture of the business with respect to donations plus the processes by which these decisions are reached.
3. At both individual and corporate levels, there is a crying need for more in the way of systematic and comprehensive theories to guide research. There is also a need for more sophisticated data analysis using multivariate statistical techniques to determine which of the many potential independent variables account for how much of the variance in donations behaviour and in what ways they interact with one another.
BIBLIOGRAPHY
Galaskiewicz, Joseph. Social Organization of an Urban Grants Economy. New
York: Academic Press, 1985.
Martin, Samuel A An Essential Grace. Toronto: McClelland and Stewart, 1985. Institute of Donations and Public Affairs Research. Corporate Giving in Canada,
1988. Montreal: IDPAR, 1989.
The Canadian Centre for Philanthropy. Canada Gives. Toronto: The Canadian
Centre for Philanthropy, 1988.
Useem, Michael. “Corporate Philanthropy”. In The Nonprofit Sector: A Research Handbook. Edited by Walter W. Powell. New Haven: Yale University Press, 1987.
VICTOR MURRAY
Co-Director, Volunteer Sector Management Program. York University, Toronto
PHELPS BELL
Director, Corporate Program. IMAGINE