The Philanthropist welcomes and, if appropriate, will publish responses to any of its articles or features.
(Reference: The Philanthropist, Vol. IV, No. 1, 1984, p.3)
The information and conclusions offered by the author of this study, J.F. Deeg, seem to me to be open to possible misinterpretation by those of us who work in charitable institutions.
To approach the study in a way that would be more informative I have made two assumptions:
1) upper income earners would usually be taxpayers 35 years and older; and 2) because of the differential between male and female incomes, the sexes should be considered separately.
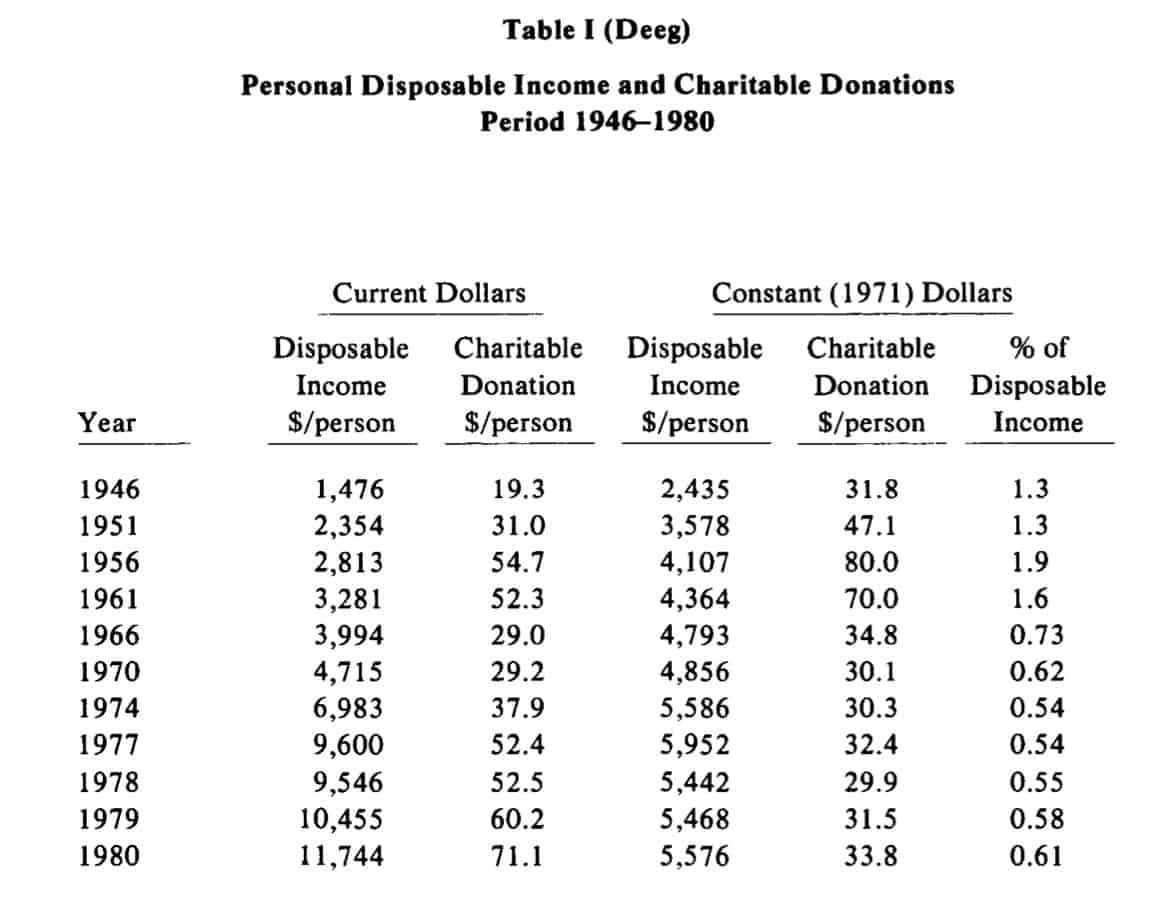
In Table I, found on page 11 of the article and reproduced on p. 44, the information provided shows that between the years 1974 and 1980, the disposable income per person had increased by 68 per cent in actual dollars but was, for all practical purposes, the same in constant 1971 dollars, i.e., $5,586 as against $5,576.
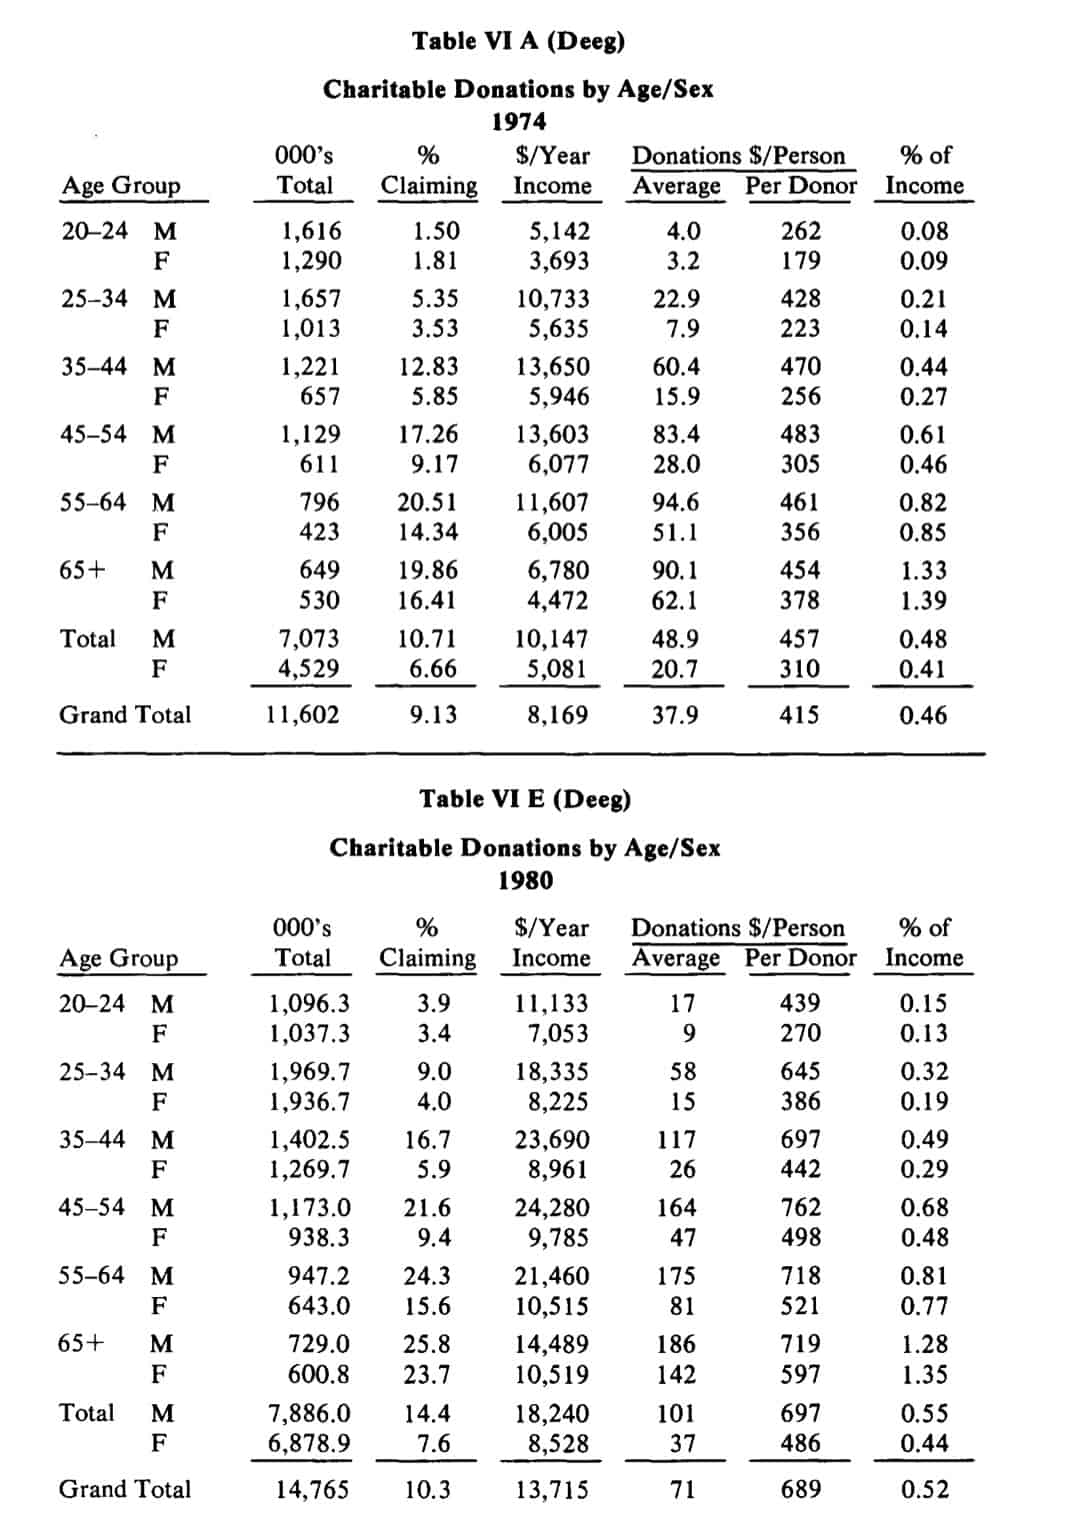
Referring to Table VI A, on page 24 (reproduced on p. 45) for the year 1974 and toTable VIE, on page 26 (reproducedonp. 45) for the year 1980, we can make the interesting comparisons shown overleaf.
Contrary to the author’s contention, I believe the information that can be extrapolated from these sets of figures indicates some interestingpositive trends in the development of the donor population. Between 1974 and 1980 the number of persons of both sexes who claimed charitable donations for tax purposes increased substantially.
In fact, with a taxpaying population increase of only 12 per cent in the male category, the number of donors increased by 40 per cent.
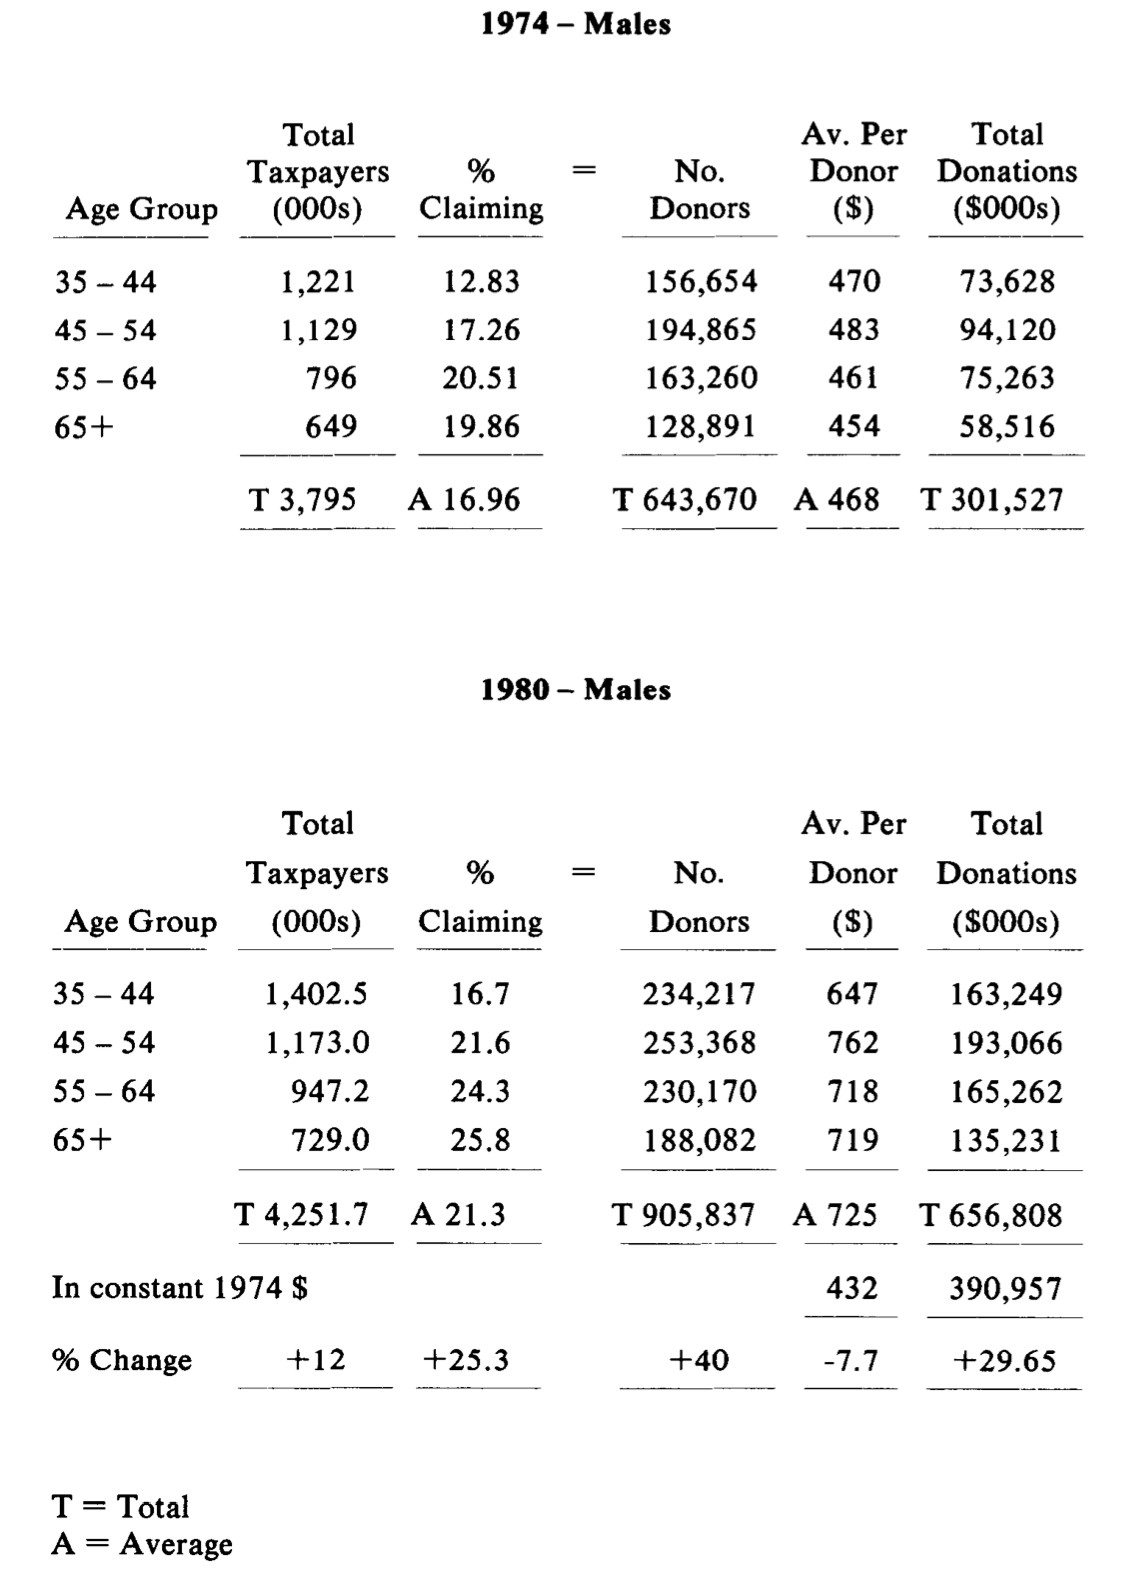
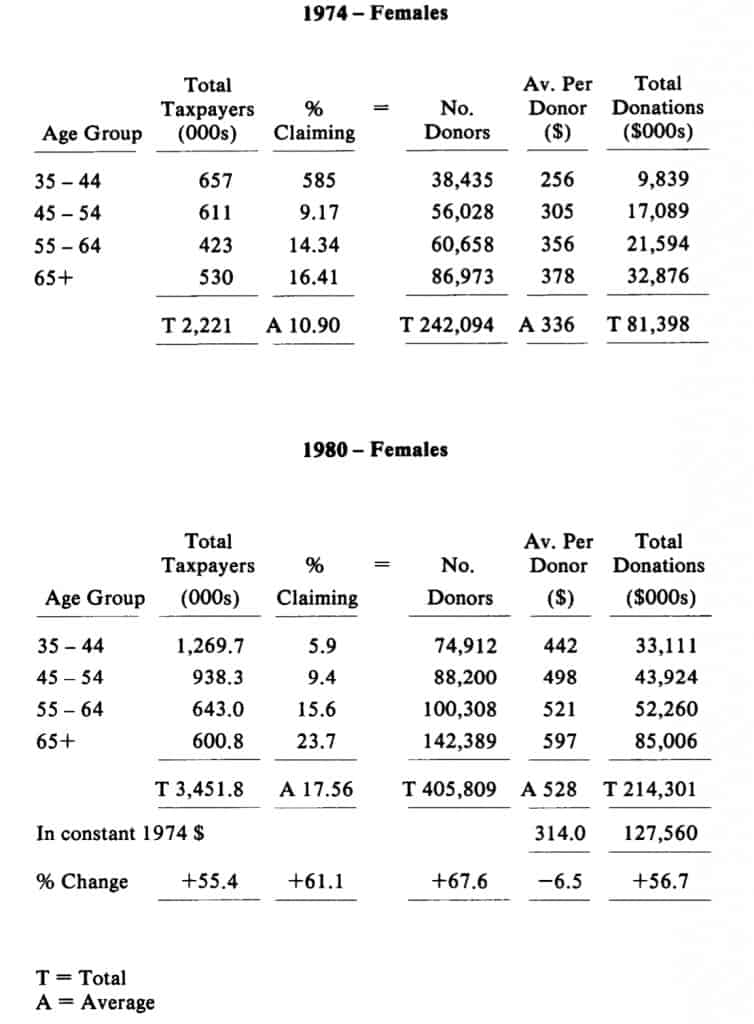
The comparison percentiles in the female grouping indicated a 55.4 per cent increase in the taxpaying population, and a 67.6 percent increase in the number of donors. Both sets of figures bode well for the future, suggesting that recognition of the need for philanthropic giving is growing among the more mature and generally more affluent community. It would seem likely that, at least to some degree, the increased professionalism of development officers and fund raising executives, as well as the increasing body of influential volunteers and community leaders in the philanthropic sector are responsible for this growth.
This optimism must be tempered by the statistics that show that average annual donations diminished by 6.5 per cent in the female group and 7.7 per cent for the males during this period. To gain some understanding of why this may have happened I referred to The National Income & Expenditure Accounts (Market Research Handbook) and found the following information:
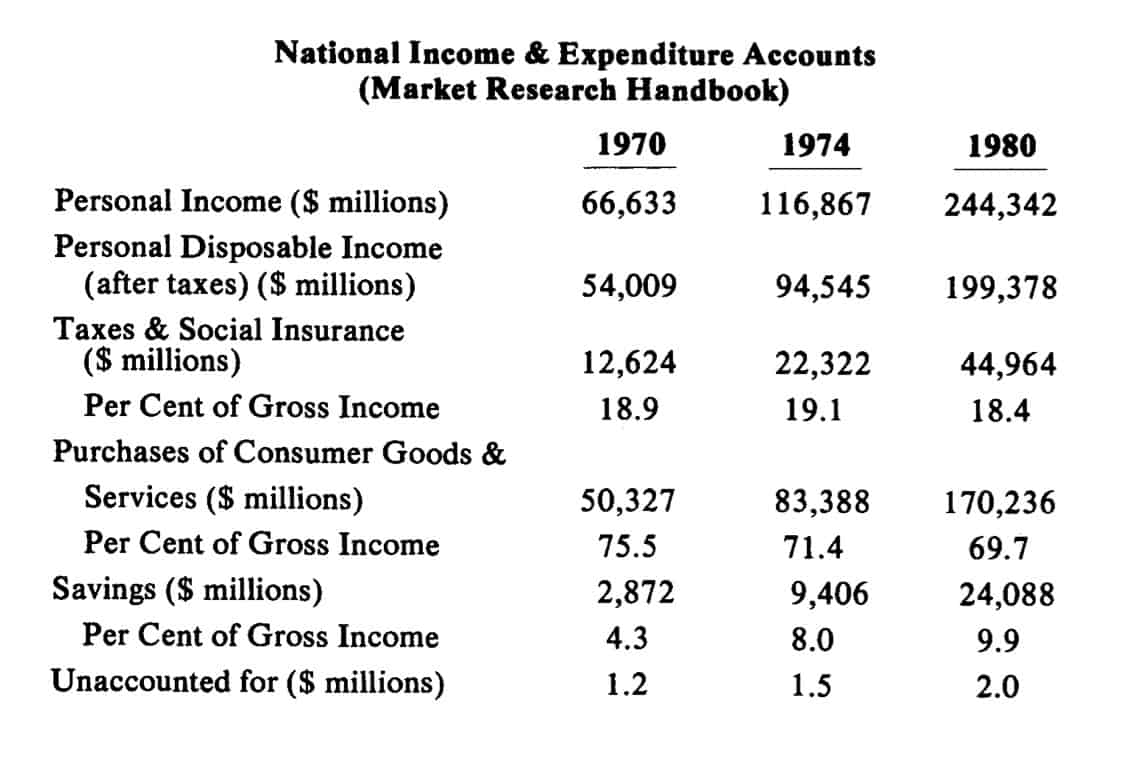
The interesting statistic in this table is in the category of Savings which shows the largest percentage increase. This may reflect the need felt by many Canadians to participate in RRSPs and other savings and insurance plans as part of their growing awareness that they must make at least some personal provision for financial security following retirement.
We found this table to be an eye opener. Our “gut feeling” had been that there had been a substantial increase in the standard and quality of living during thisperiod reflecting expenditures for things which had formerly been regarded as “discretionary” but which had become “necessities” for a large percentage of the middle class. Golf and social club memberships, private schools, music and dance lessons for children, and stereo and video technology et al, we thought represented important cultural and material changes in spending habits which would reduce substantially the discretionary income available for philanthropy. However, the information in this table refuted this prejudgement-highlighting instead the substantial increase in savings.
Michael Wilson’s budget of May 23, 1985 attempts to encourage more speculative investments on the part of Canadians but there appears to be an underlying popular perception of instability in the Canadian economy with its continuing dependence on the U.S. economy and U.S. fiscal policy. This appears to confirm that there are too many economic factors over which Canadians have little or no control. Recent increases in savings may reflect an increased sense of insecurity in the Canadian middle class.
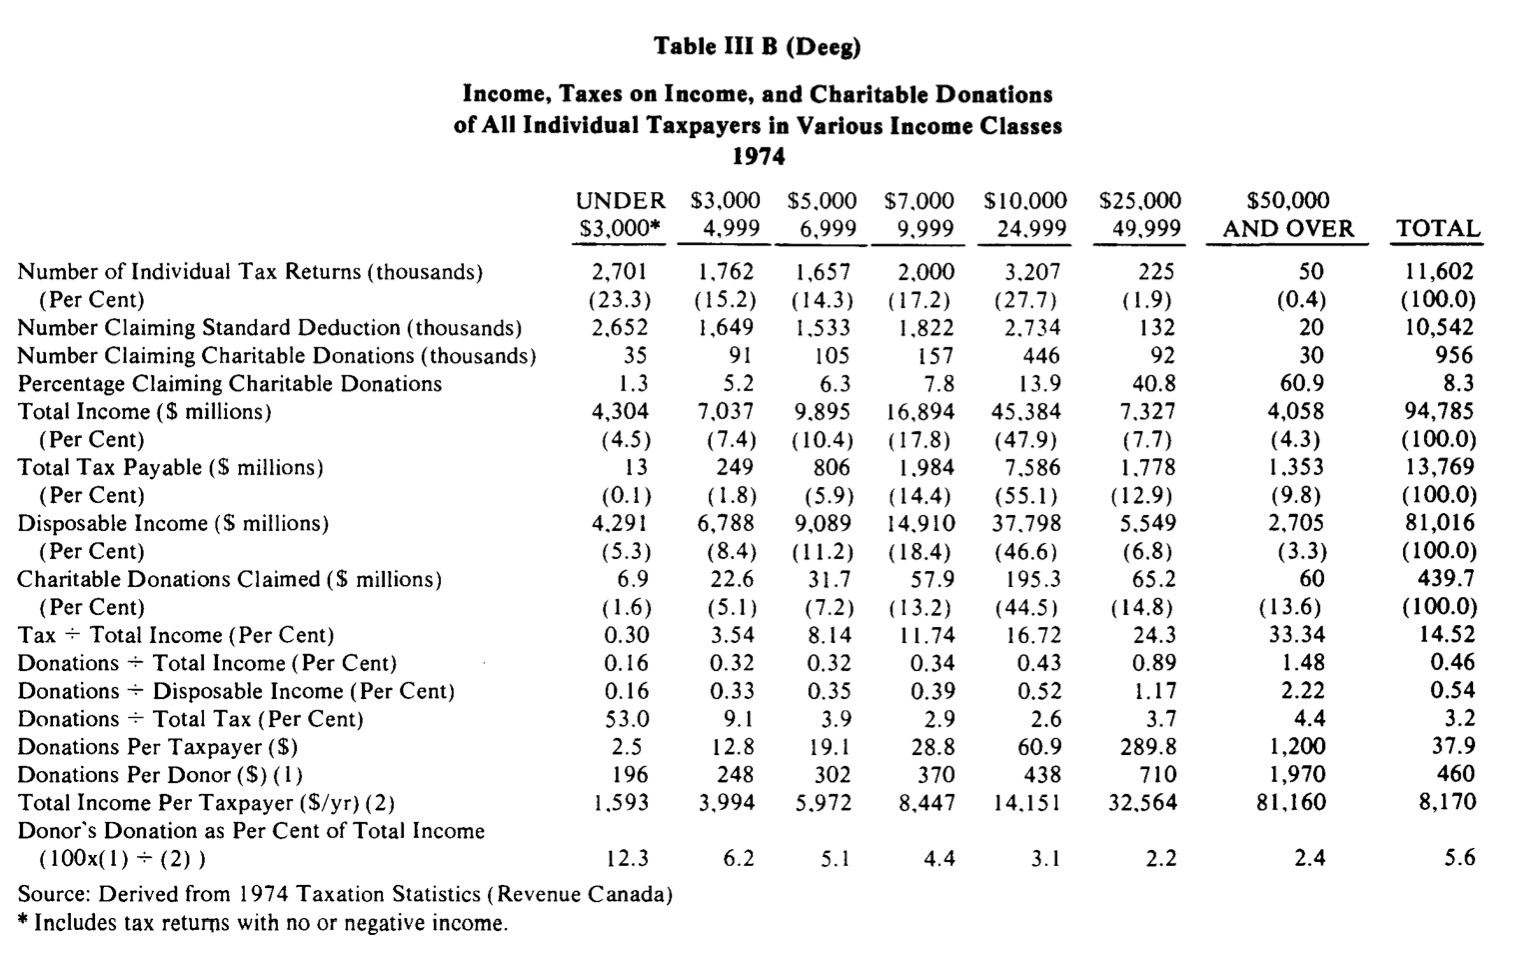
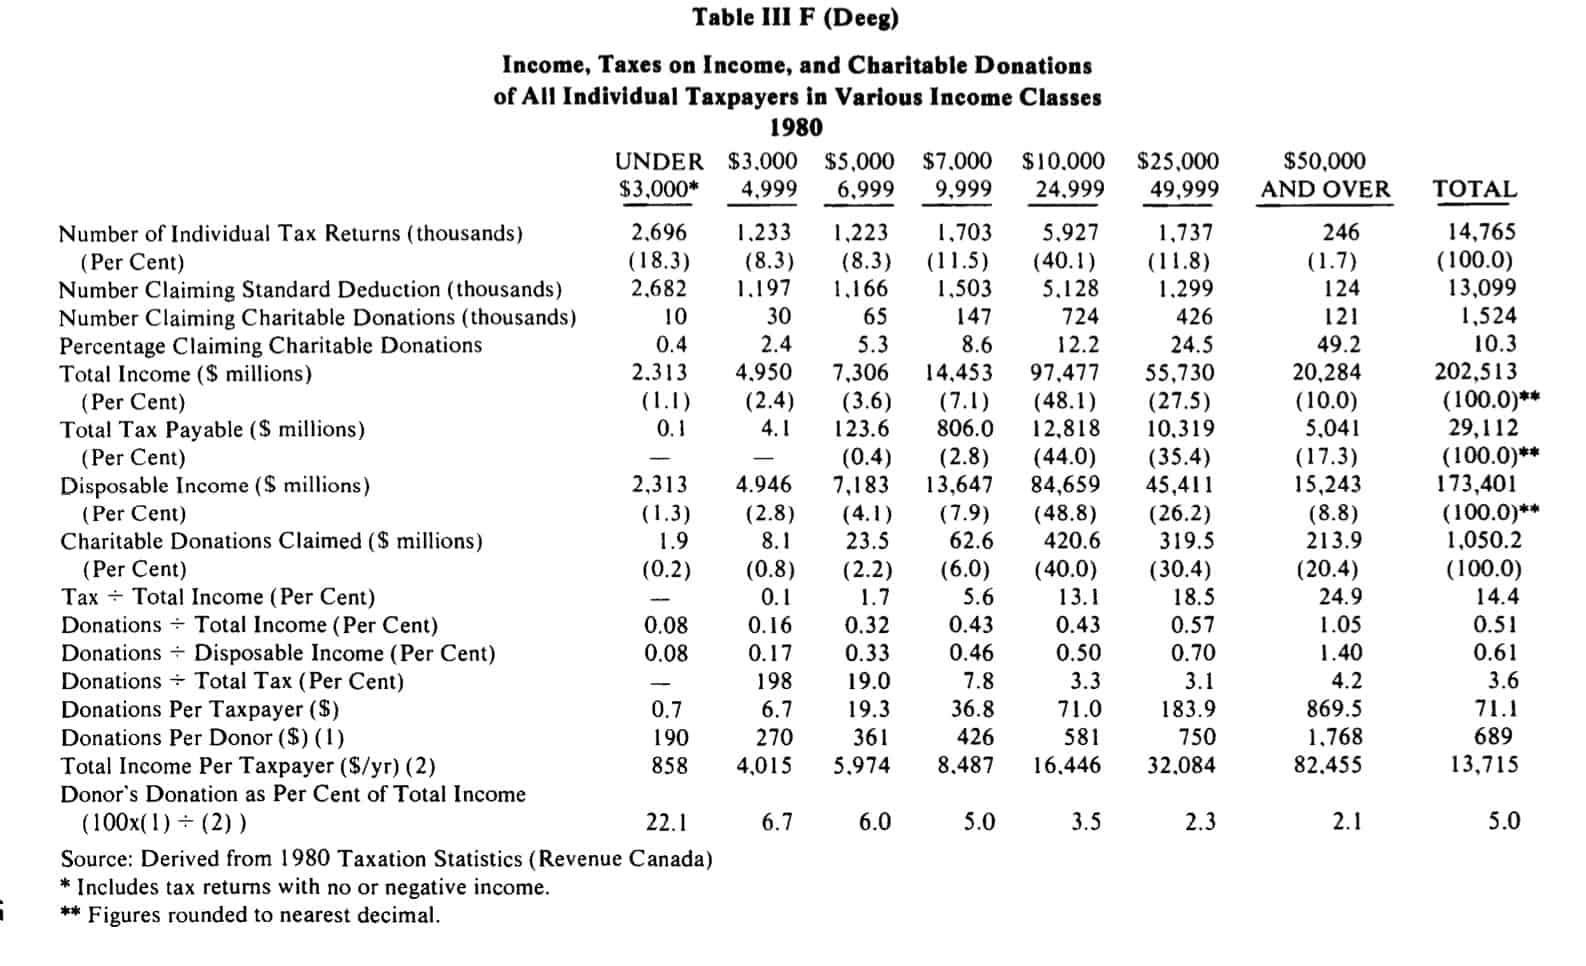
In attempting to analyze Tables III-Band III-F on pp, 13 and 17, (reproduced on pp. 46 and 47) we found the categories used were too broad to permit evaluation of the sub-group, “Number Claiming Charitable Donations” because the appropriate total income and disposable incomes for this category were not shown. It would be more useful to extract only that information which applies to the number claiming charitable donations with all succeeding statistics in that table relating to this sub-group.
We believe it is important for all of us who are concerned with the social needs of the community and who do not wish to have a welfare state thrust upon us, that we recognize where we are succeeding and where we may be failing. These become the areas for further analysis and attention.
We still do not know from Deeg’s tables whether donors (individuals and corporations) are, in fact, giving less in constant dollars in any comparable year as long as we mix sub-groups with groups when we are analyzing taxation statistics.
The necessary information may not be available under the current Revenue Canada reporting system, but if it is necessary, and we believe it is, we could, through our representative lobbying groups, ask for it through the appropriate channels. We would still be preserving the confidentiality of individual tax returns but it would be most helpful to have the statistical information we need to deal with donors claiming, for example, a minimum of $1,000 per year in charitable donations on their tax forms. If these statistics were broken down by age, sex, donation categories, income categories, and city, we could undoubtedly put this additional information to effective use.
In the meantime let us take heart from our present knowledge that in 1974 there were 885,764 donors over 35 years of age claiming charitable deductions in excess of the (then) standard $100, and, in 1980, this number grew to 1,311,646, an overall increase of 48 per cent.
APPENDIX