Preface
In 1975 Professor Samuel A. Martin of the Business School of the University of Western Ontario published his landmark volume, Financing Humanistic Service, an in-depth analysis of previously unassembled data relating to philanthropy in Canada. Professor Martin’s work was, and remains, an invaluable reference for all those in both the public and private sectors who are responsible for the “humanistic services” that are so important a factor in Canadian society. Nevertheless it has been obvious for some time that more frequent, if less comprehensive, analyses are badly needed.
The Canadian Centre for Philanthropy was founded in 1980 for the purpose of encouraging philanthropy in Canada. The Centre believes that one useful way in which that encouragement can be provided is a series of statistical studies which will assist all those in the philanthrophic sector to understand current and changing conditions, levels and patterns of giving and problem areas as they develop or emerge.
This is the second update of the first of these papers. We acknowledge with gratitude this work of J.F. Deeg and the assistance of Professor Martin in its preparation.
It is our hope that it will be used by others as a point of departure for additional, or more highly refined analyses that will further increase our knowledge and understanding of philanthropy in Canada.
Allan Arlett
Executive Director Canadian Centre for Philanthropy Toronto, Ontario
Foreword
These tables, which update and expand an earlier analysis of personal charitable donations, offer valuable, if not comforting, information for all who are concerned with the problems of financing human services in their communities.
A word of caution is in order regarding interpretation of the tables. The unit of measurement is the individual tax return-some 14 million in 1980-filed by almost two out of three Canadians. With the exception of Tables VIII through X, these are not per-family donations data. Since 1970, the growth in the number of tax returns ( +60 per cent) has been much greater than population growth (10 per cent), and the growth in the work force ( 30 per cent). Interpretation is further complicated by the increase in work force participation by females since 1970 (from
34 per cent to 47 per cent) which has resulted in a sharp increase in the number of tax returns filed by females. Since incomes reported by females averaged only 50 per cent of male incomes and donations per reporting female are appreciably smaller than those of their male counterparts (see Tables VI A through VI E), the resulting mean calculations used in the tables must be interpreted accordingly. Notwithstanding, the trends revealed by the tax return data tend to be verified by the family donations data presented in the concluding tables.
The data confirm that individual generosity continued to decline in Canada through the 1970’s. The proportion of Canadian taxpayers claiming charitable donations (i.e., over $100) in 1980 was significantly lower in all income categories. But one is struck by the sharp and alarming drop in donations by upper income Canadians-$50,000 and over-precisely the population segment with the greatest capacity to give. Less than half these individuals (49 per cent) claimed donations in excess of the standard $100 dollar deduction in 1980-down from 78 per cent in 1970. This means that some 124,000 Canadian taxpayers, earning an average income of $82,000 in 1980, claimed the standard $100 deduction, pocketed their marginal tax on this amount and presumably contributed little if anything to community appeals. The trend was equally noticeable among doctors, lawyers, investors, and salaried employees.
The implications of this continuing trend are profound. These are society’s leaders—the people who hold influential positions, control economic resources, speak articulately for themselves and their institutions, and most importantly set the values, by example, for their fellow citizens. Since the trend has held for the past four years, a clear majority of the most affluent Canadians now chooses not to share its affluence through voluntary (and tax deductible) contributions. A good deal more research and thought must be given to understanding why this is taking place and what actions, if any, can be taken to reverse the trend. The alternative is continued erosion and ultimate eradication of private sector influence on social institutions in Canada.
Still, there are some encouraging signs. First, those who do contribute (a declining sector) are being more generous than ever-an average of 5.0 per cent ofincome in
1980 compared with 4.3 per cent in 1970. Second, pensioners, a growth sector with less than half the annual income of the average taxpayer, devoted more than twice the average percentage of their incomes to charity. Third, more than twice the percentage of the most youthful taxpayers—the 20-24 age group-claimed donations in 1980 as claimed them in 1974. (Small comfort-they moved from
1.6 per cent to 3.7 per cent, still by far the lowest claiming group.)
I commend The Canadian Centre for Philanthropy for undertaking this helpful analysis.
Samuel A. Martin
Professor,
The University of Western Ontario
An Analysis
In 1975, Professor Samuel A. Martin in his book Financing Humanistic Service developed data with respect to individual charitable giving. This information was based on Taxation Statistics, an annual report published by Revenue Canada, Taxation. In this report an analysis of individual tax returns is presented, data being based upon a stratified random sample of individual tax returns.
Martin’s work examined the period 1946-1970. His key conclusion(page 48) was that “by any economic comparison, the average Canadian is economically far betterofftoday than was the average Canadian at the end of the Second World War. But while we are now much more prosperous, the average Canadian actually has reduced in absolute as well as in relative terms the proportion of his wealth that he contributes directly and voluntarily as an individual to the betterment of his community”.
This analysis has now been extended to 1980, the latest year for which taxation statistical data are available.
Unfortunately, the trend which Professor Martin observed for the period 1946-1970 continued during the period up to 1980. Canadians’ average disposable income rose markedly but the percentage devoted to charitable contributions declined. However, 1979 and 1980 figures indicate that the decline may have bottomed out and that Canadians may have started to become more charitable again.
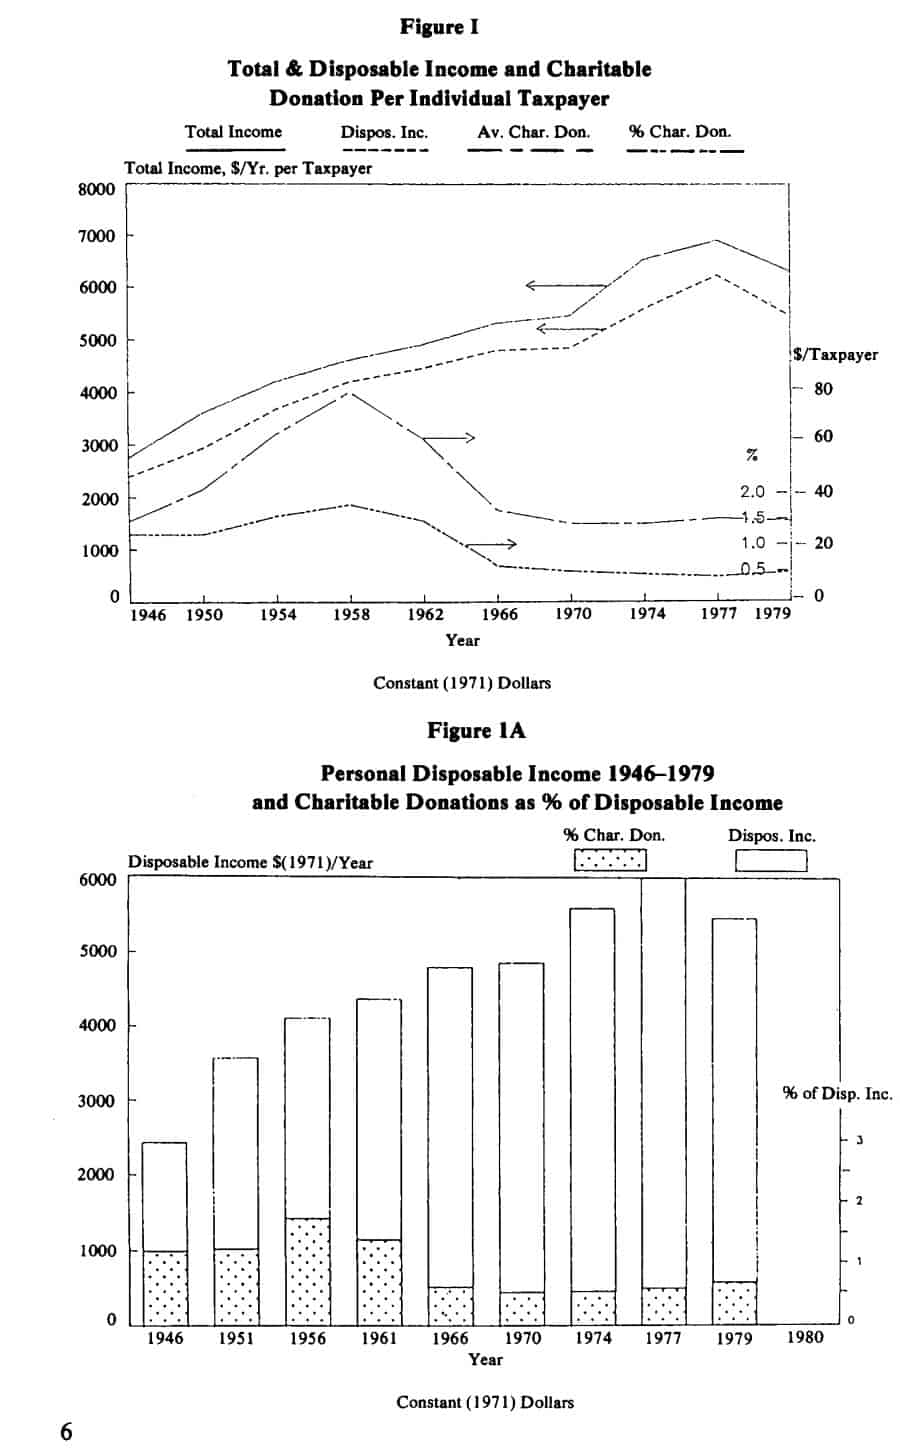
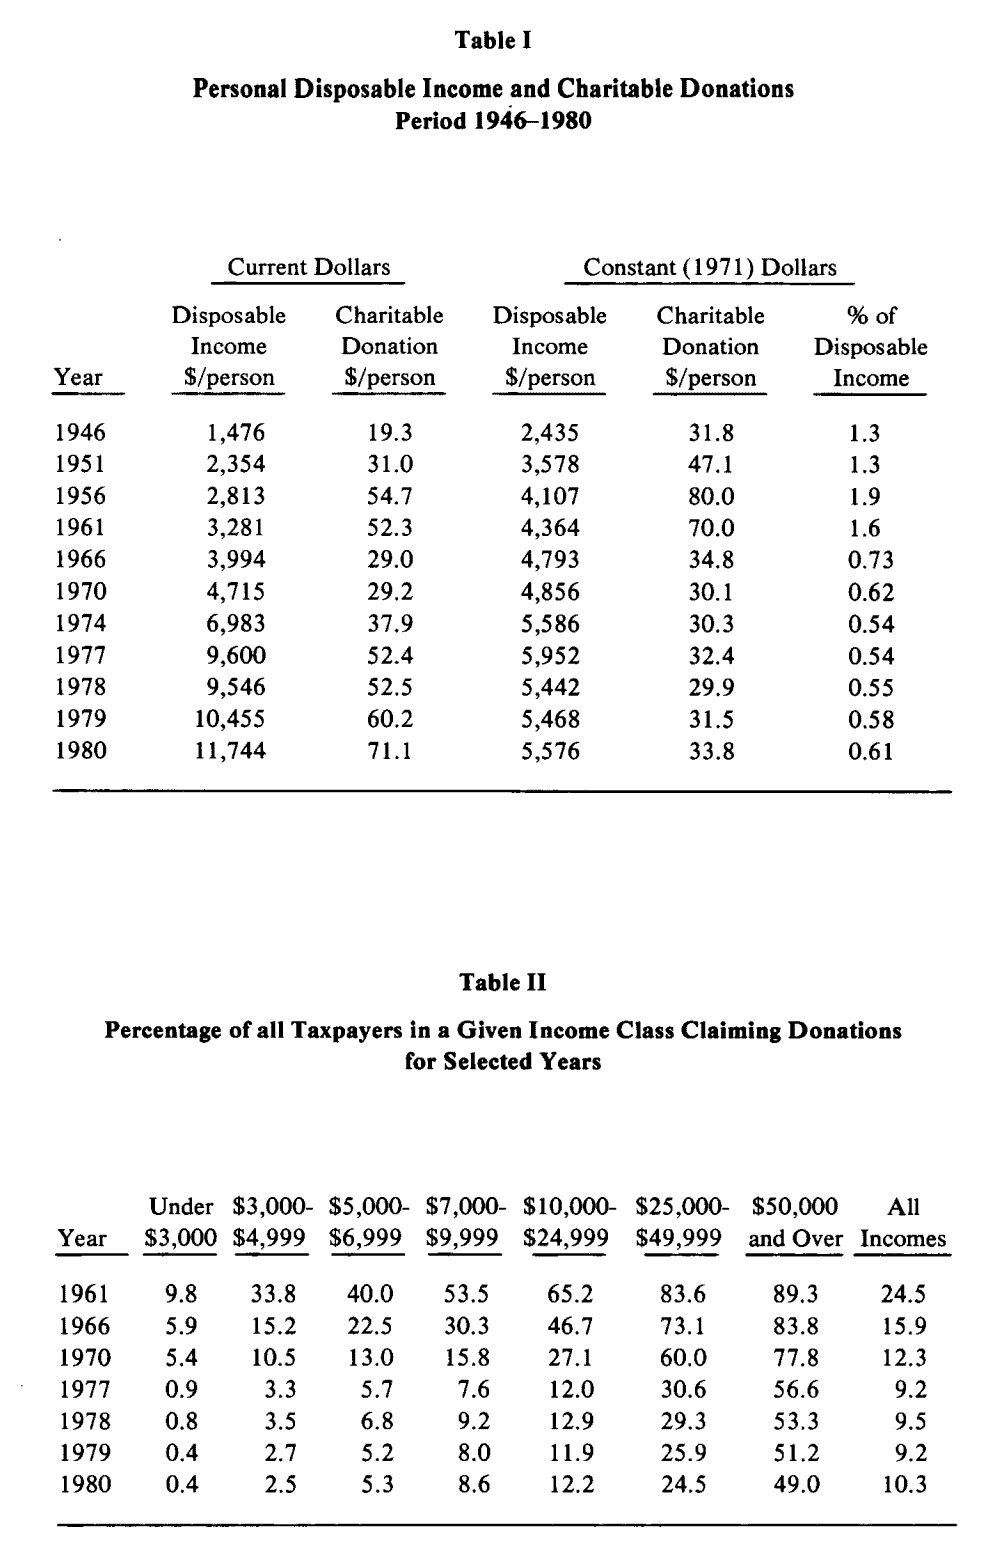
Table I (page 11) shows that from 1946-1980 disposable personal income, i.e., total income less federal and provincial tax, has increased almost eightfold. Over the same period the amount of claimed charitable donations increased by a factor of 3.7.
If we adjust the dollar amounts for inflation by dividing them by the Consumer Price Index expressed in constant 1971 dollars, we still find that between 1946 and 1980 disposable personal income increased by a factor of 2.2 (from $2,435 per year in 1946 to $5,5 76 per year in 1980) whereas claimed charitable donations remained constant ($31.80 per year in 1946 and $33.80 per year in 1980).
It will be noticed that only in the period 1951-1956 did charitable donations rise absolutely, as well as in percentage points. However from 1956 on, charitable donations as a percentage of average disposable personal income dropped from 1.6 to a low of 0.54. Recently this percentage has been gradually rising again. Figure I and the bar chart, Figure lA (page 6), illustrate this.
Another striking observation emerges from a comparison of the proportion of all taxpayers claiming charitable donations over the years. This comparison is made from 1961 on and is based on reported”standard deduction” claims as given in the taxation statistics table. Table II summarizes this data.
It will be seen that the proportion of charitable donation claimants increases with increasing income. However, over the 20-year period from 1961 to 1980 the proportion of claimants in each income group has steadily declined: percentages in the low income group (under $3,000) declined from 9.8 to 0.6; in the $10,000-$24,999 income group from 65.2 to 12.2; and even in the$50,000+ income group from 89.3 to 49.0. In other words, whereas 20 years ago about 25 out of every 100 taxpayers contributed visibly to charity, by 1980 this number had dropped to 10 out of every 100.
Analysis by Income Group
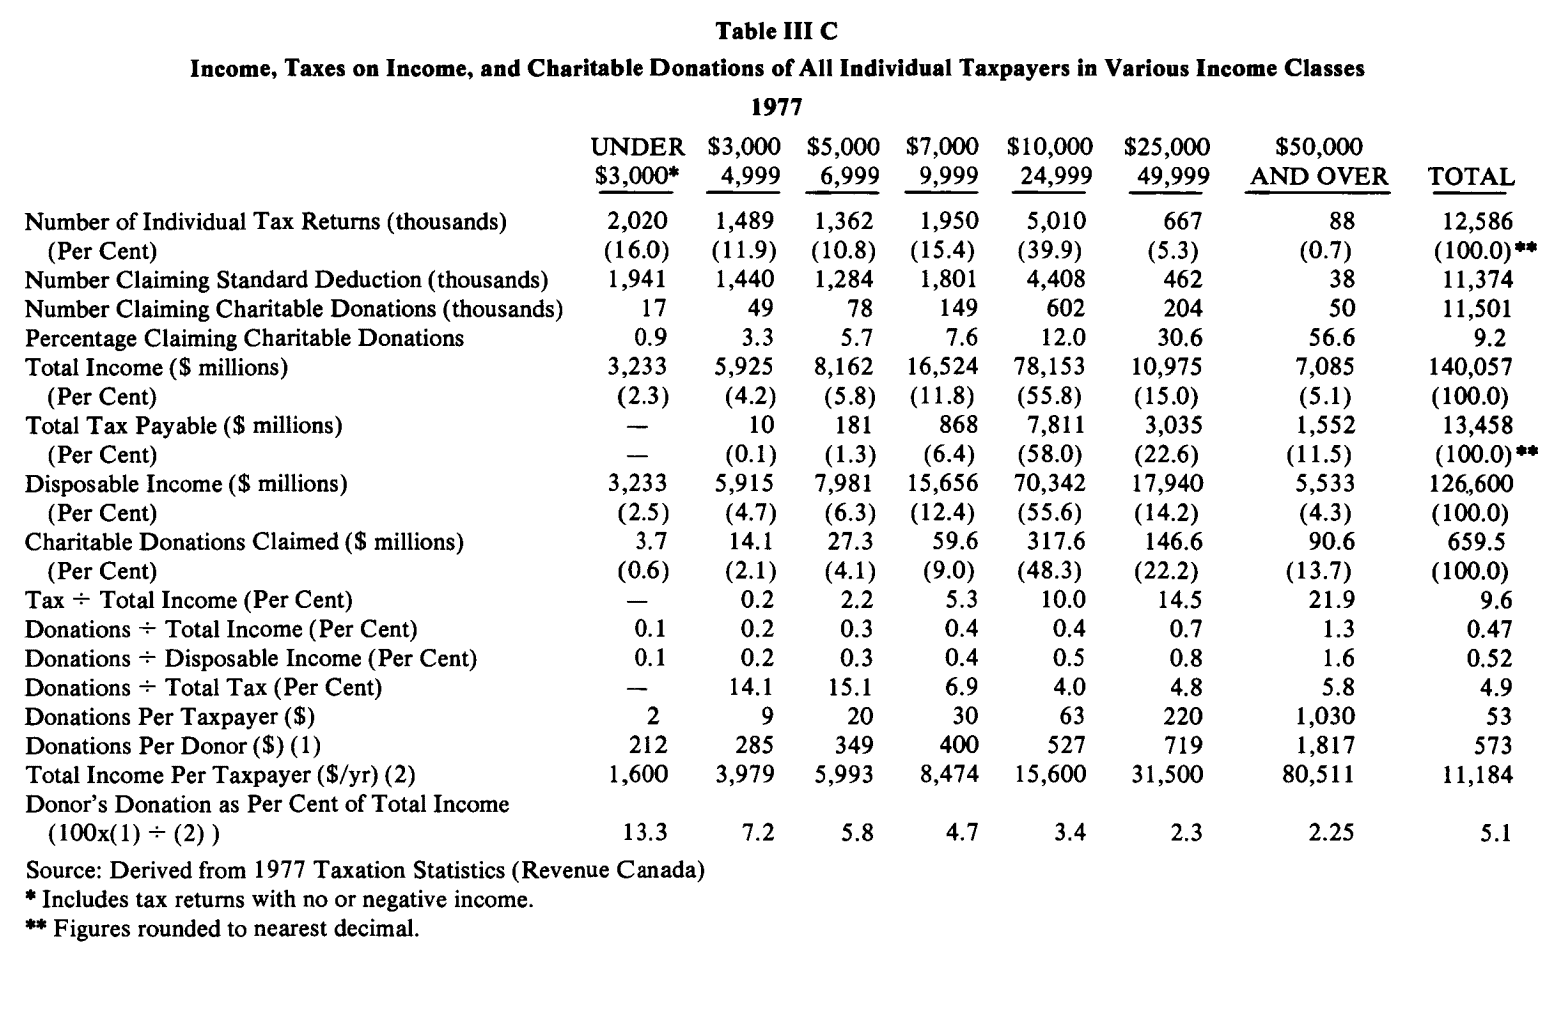
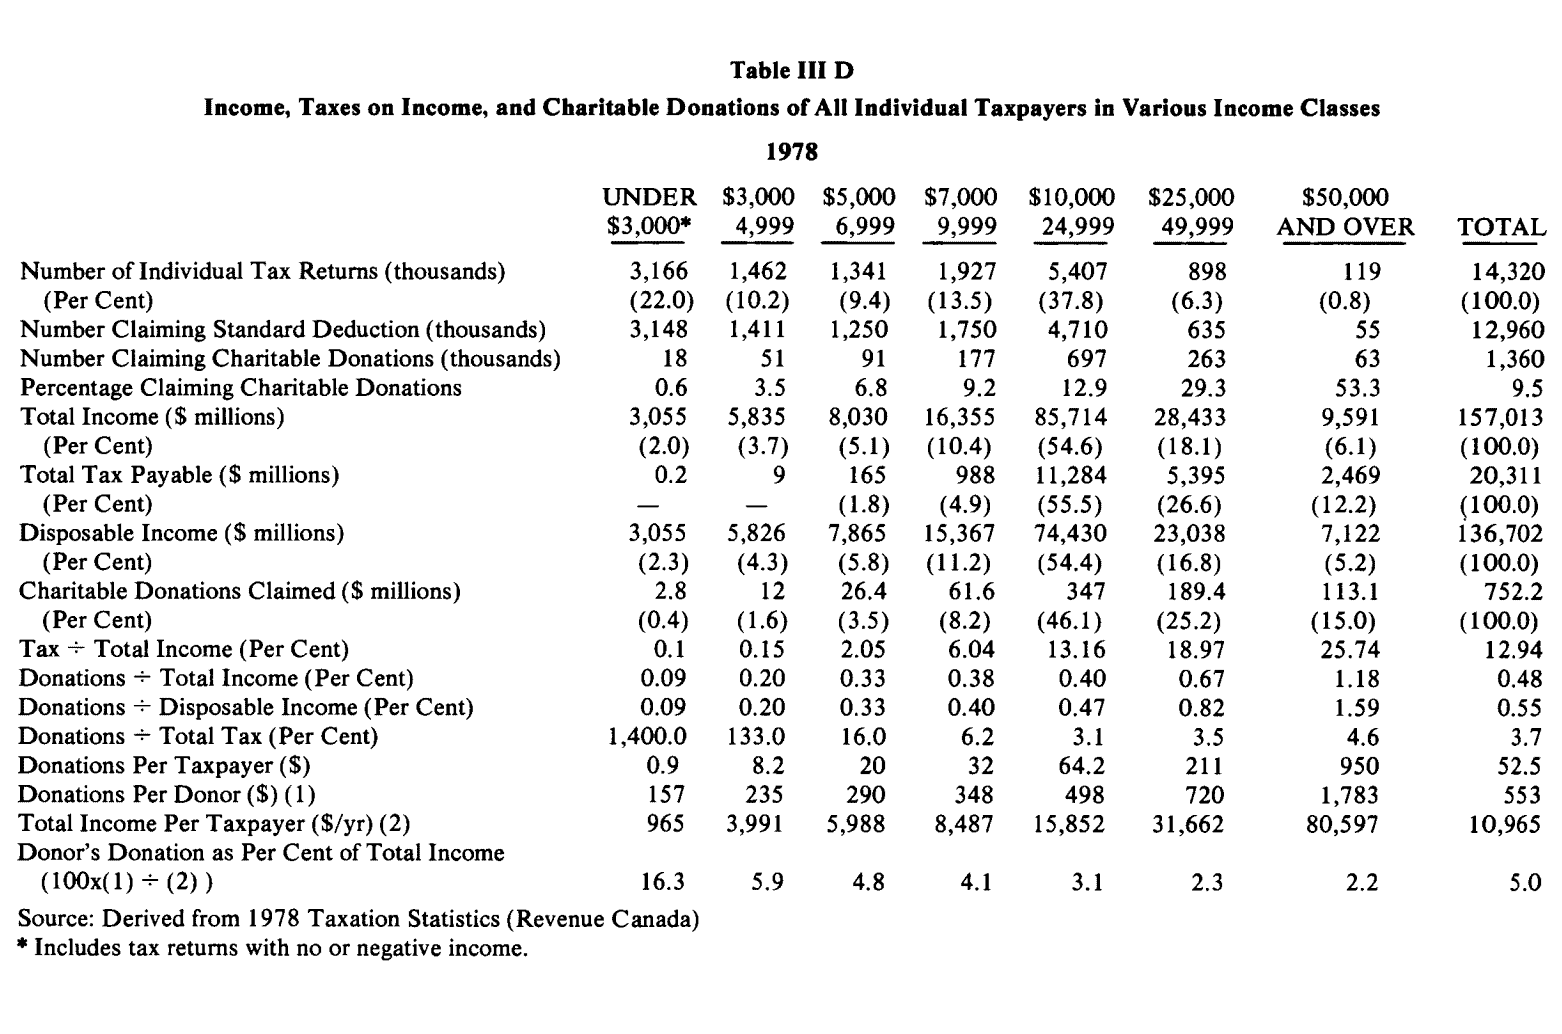
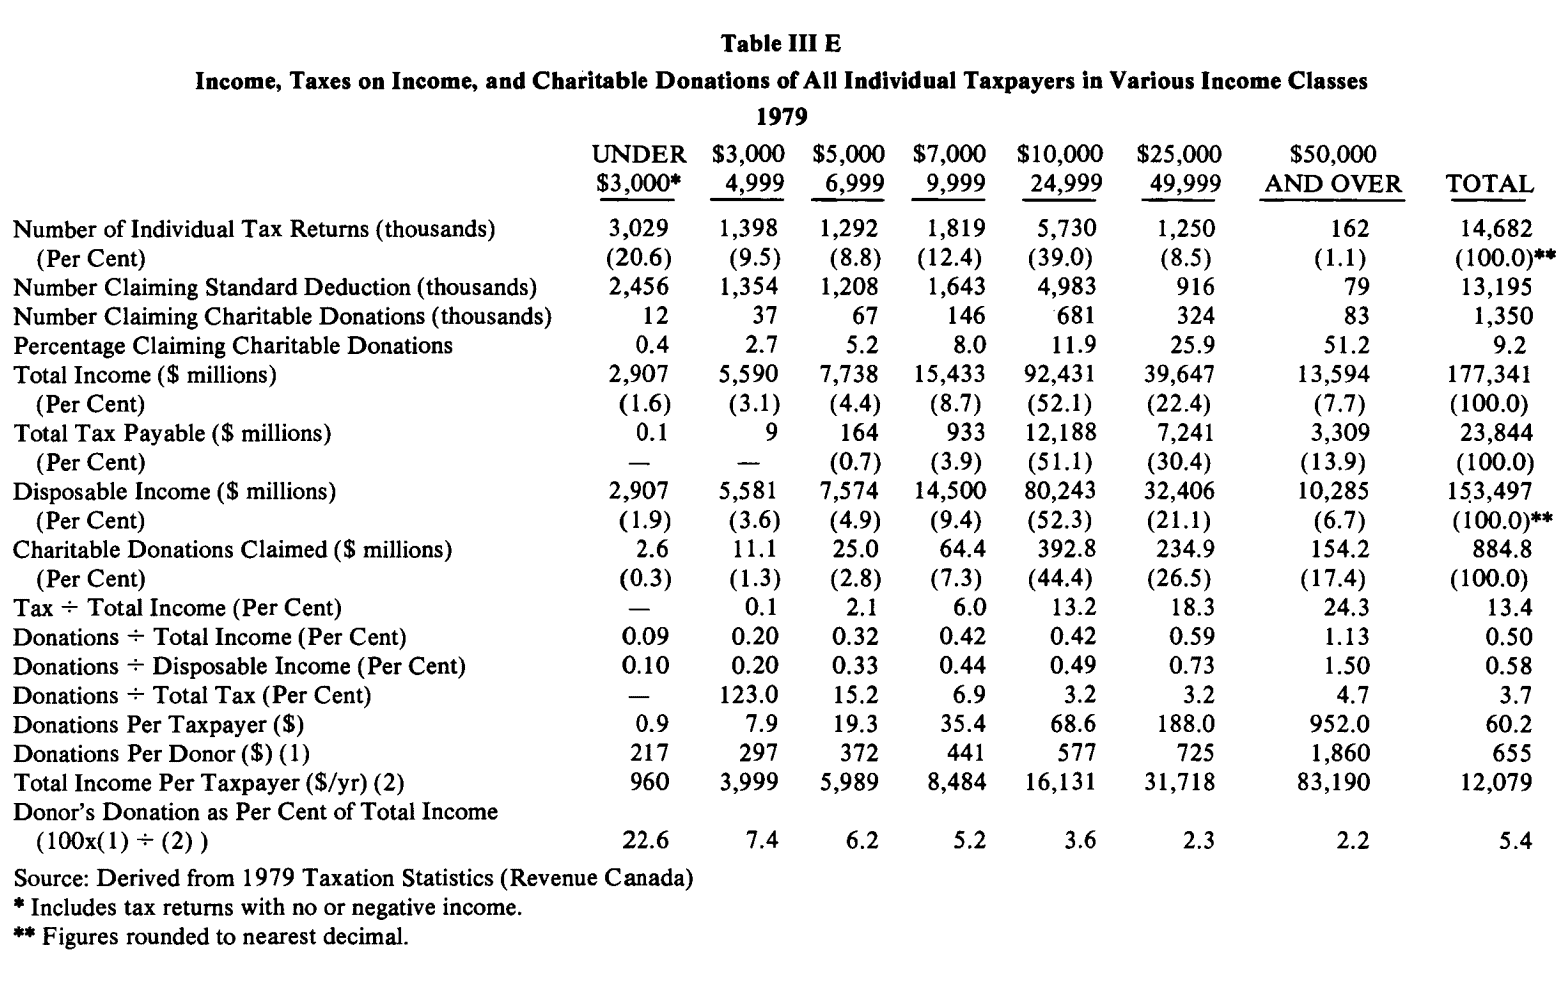
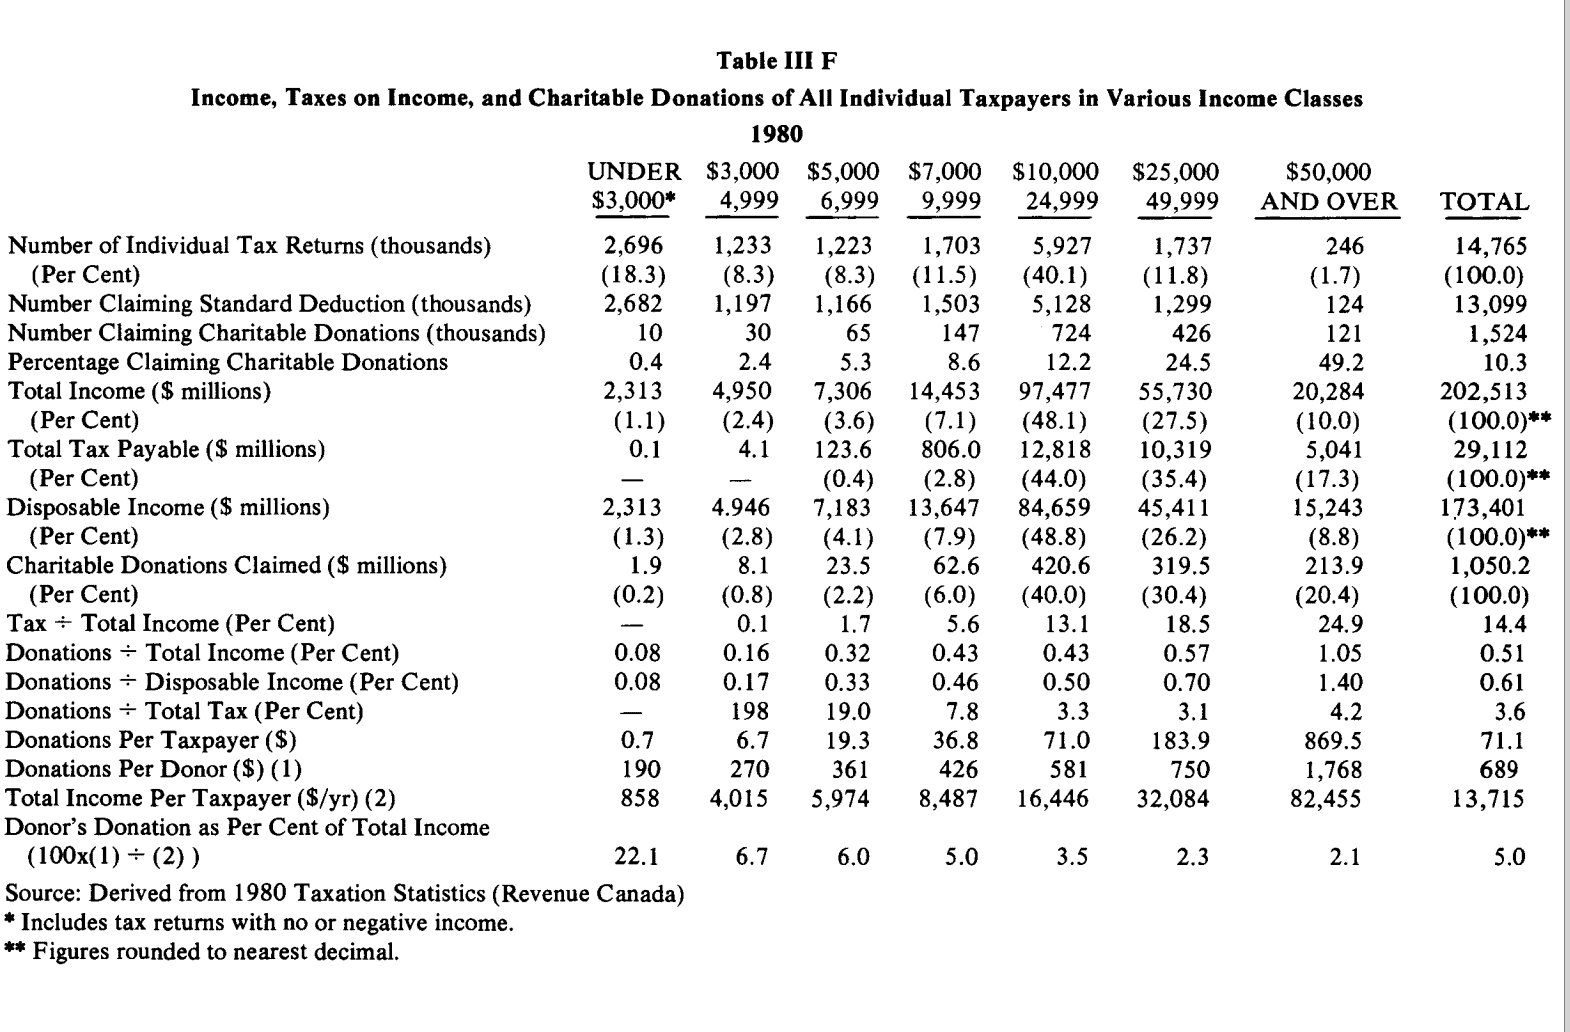
Tables III A through III F summarize income and donations for 1970, 1974, 1977, 1978, 1979 and 1980, grouped by income classes from under $3,000 to $50,000+. We have already seen that the percentage of claimants steadily declined for all income classes.
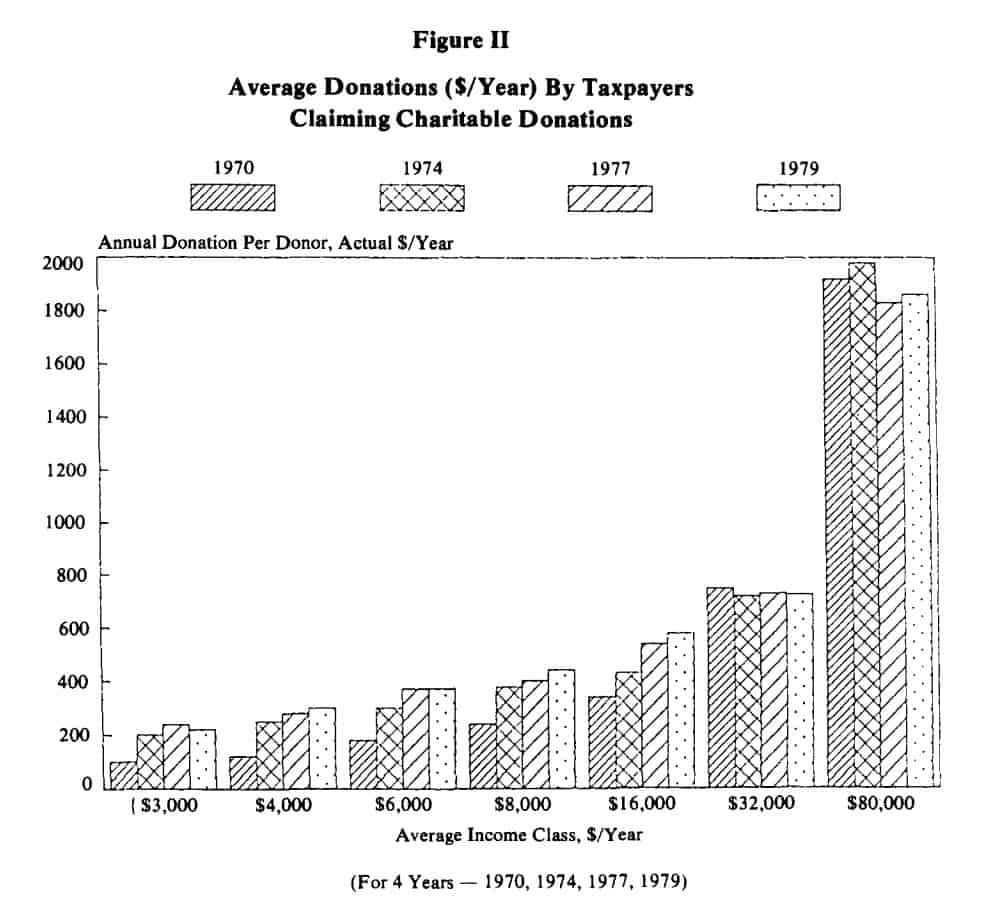
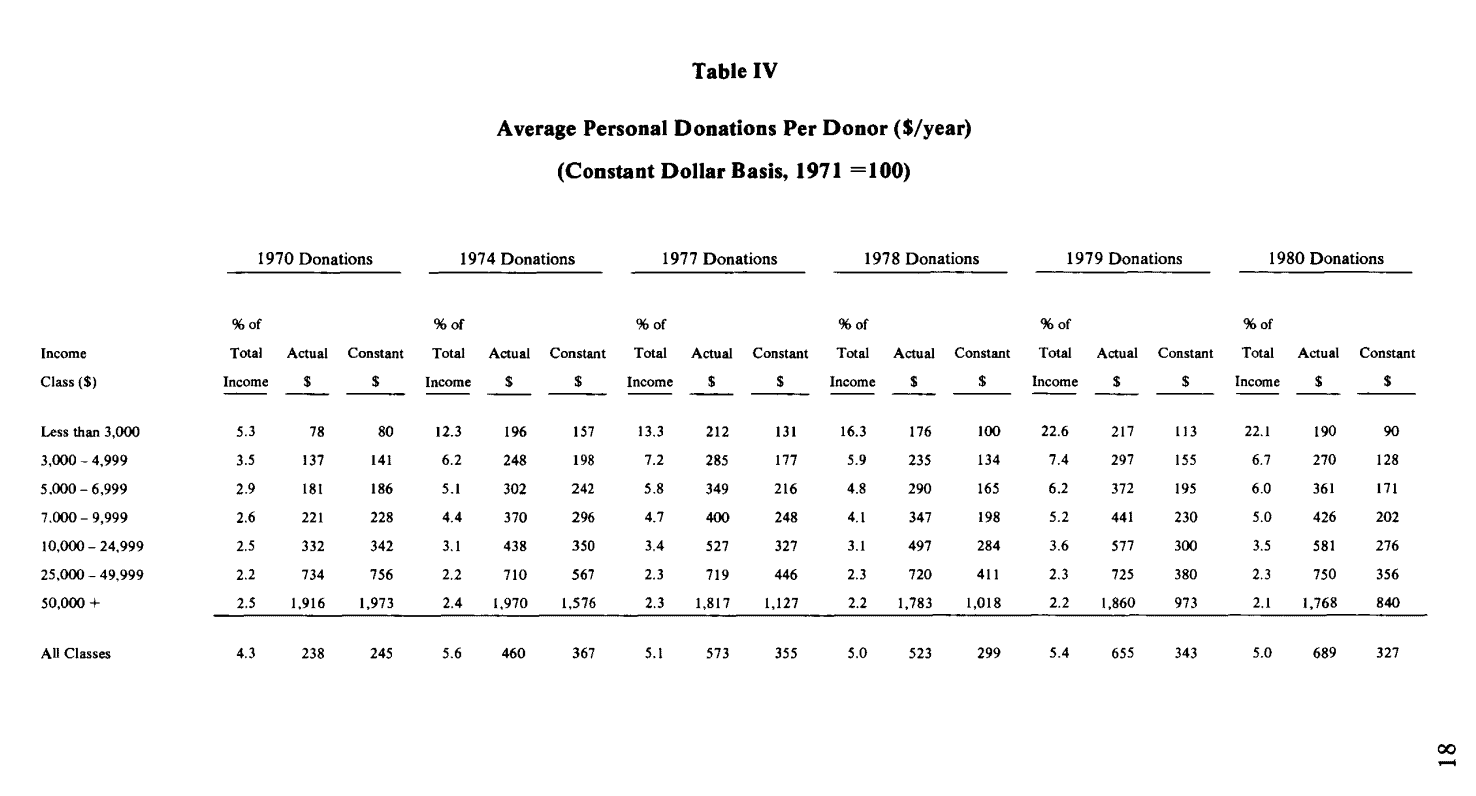
Table IV summarizes the average personal donations per donor per year for seven income classes for the six years 1970, 1974, 1977, 1978, 1979 and 1980. These average personal donations are also shown on the bar chart, Figure II.It should be kept in mind that in this chart, only those taxpayers who claim charitable donations over the standard $100 are considered. It will be seen that for each income class (except the $50,000+ class) the annual charitable donations increased between 1970 and 1977, dropped during 1978, but went up again in 1980. Figure III also illustrates this trend.
Figure II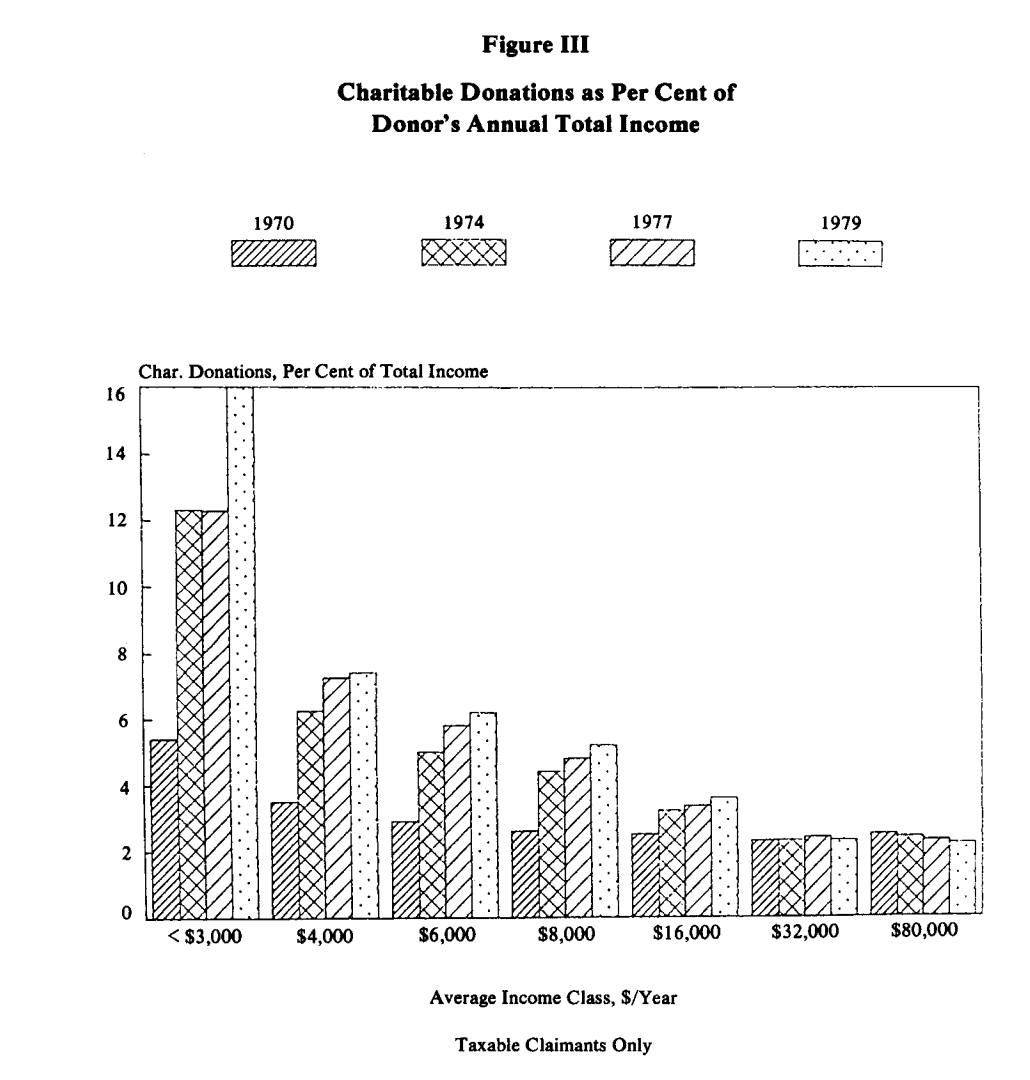
Analysis by Geographic Location
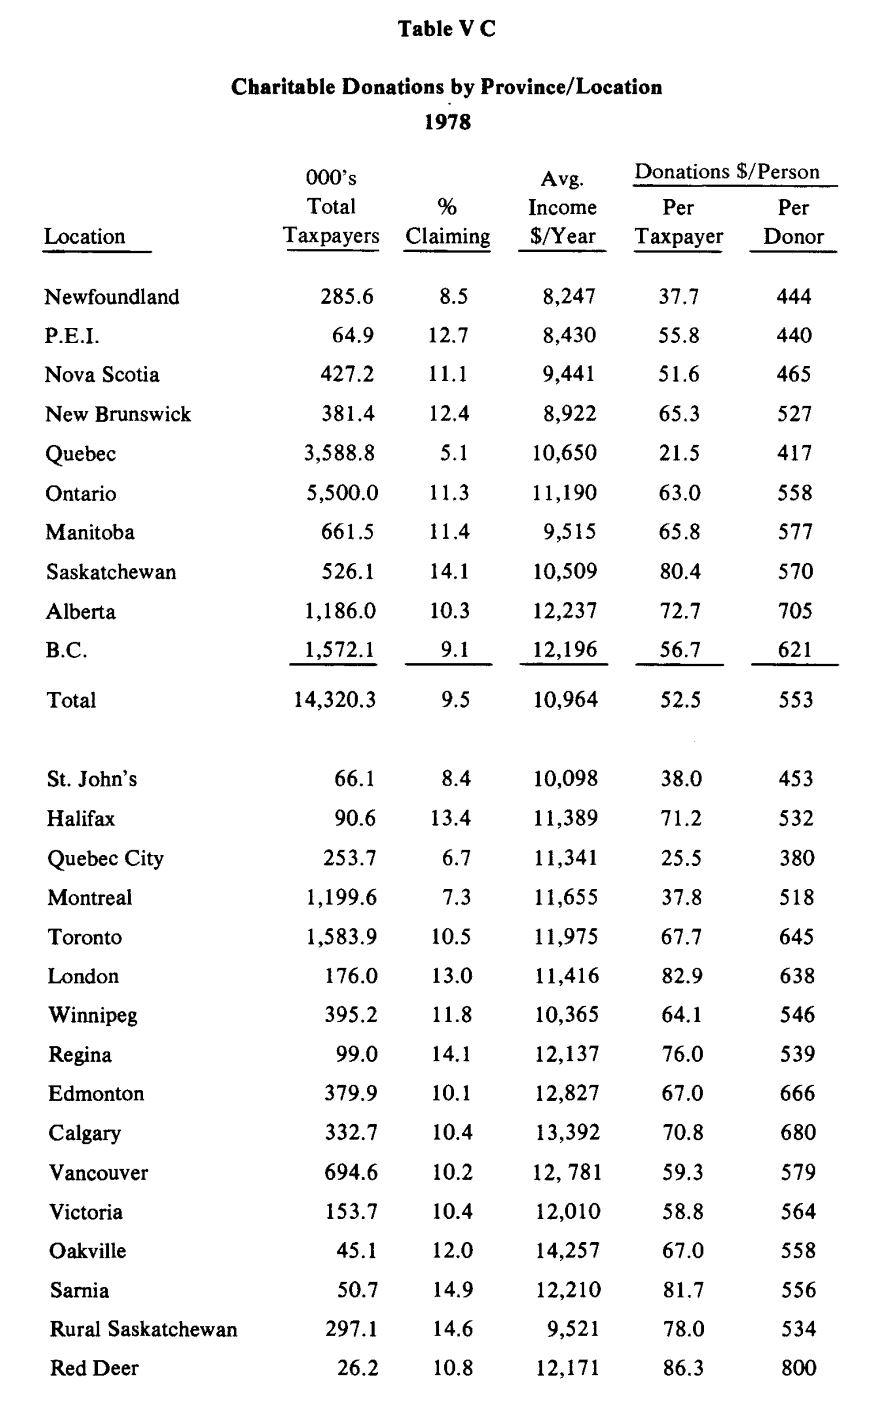
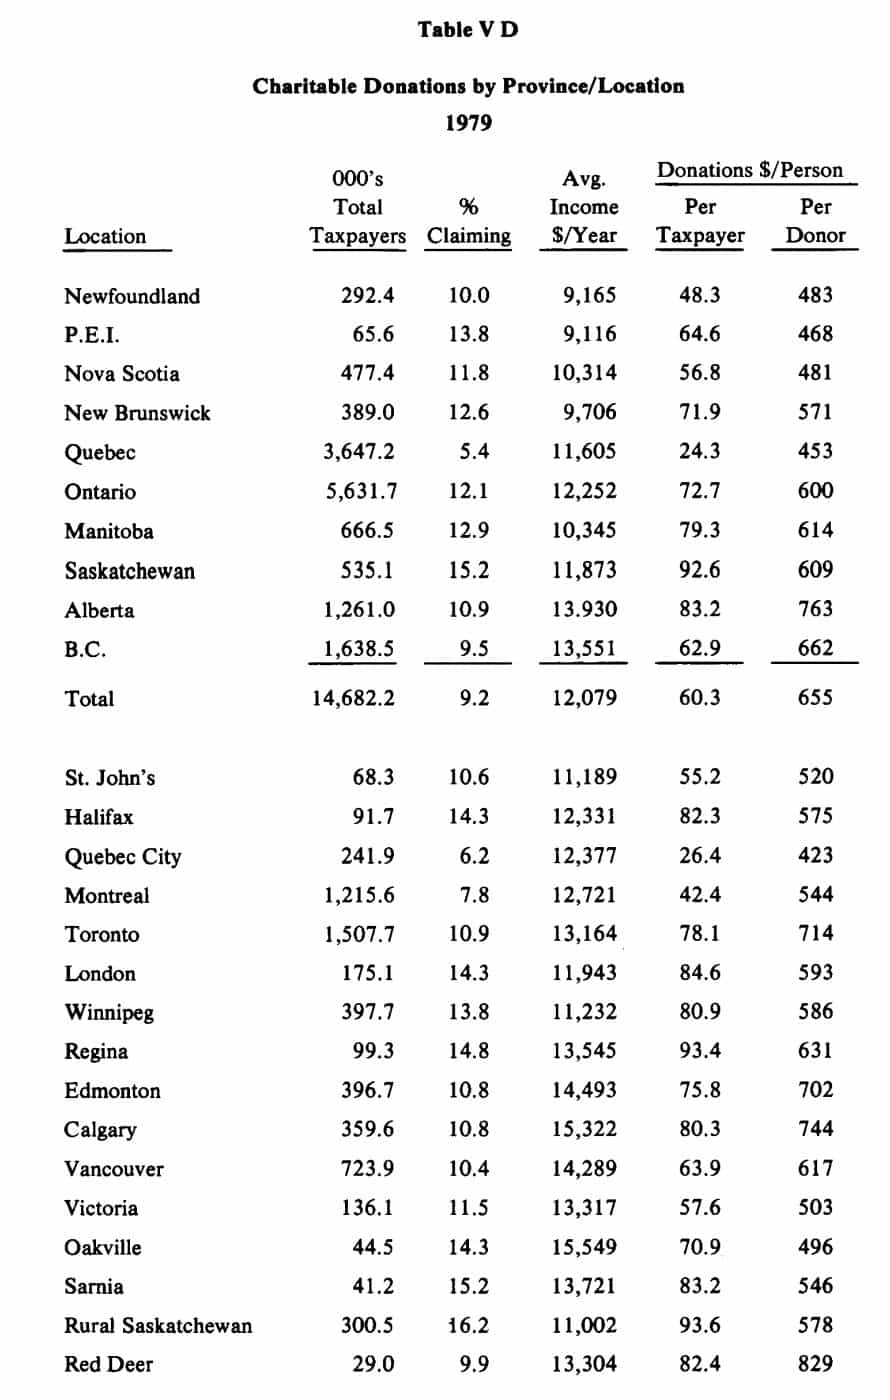
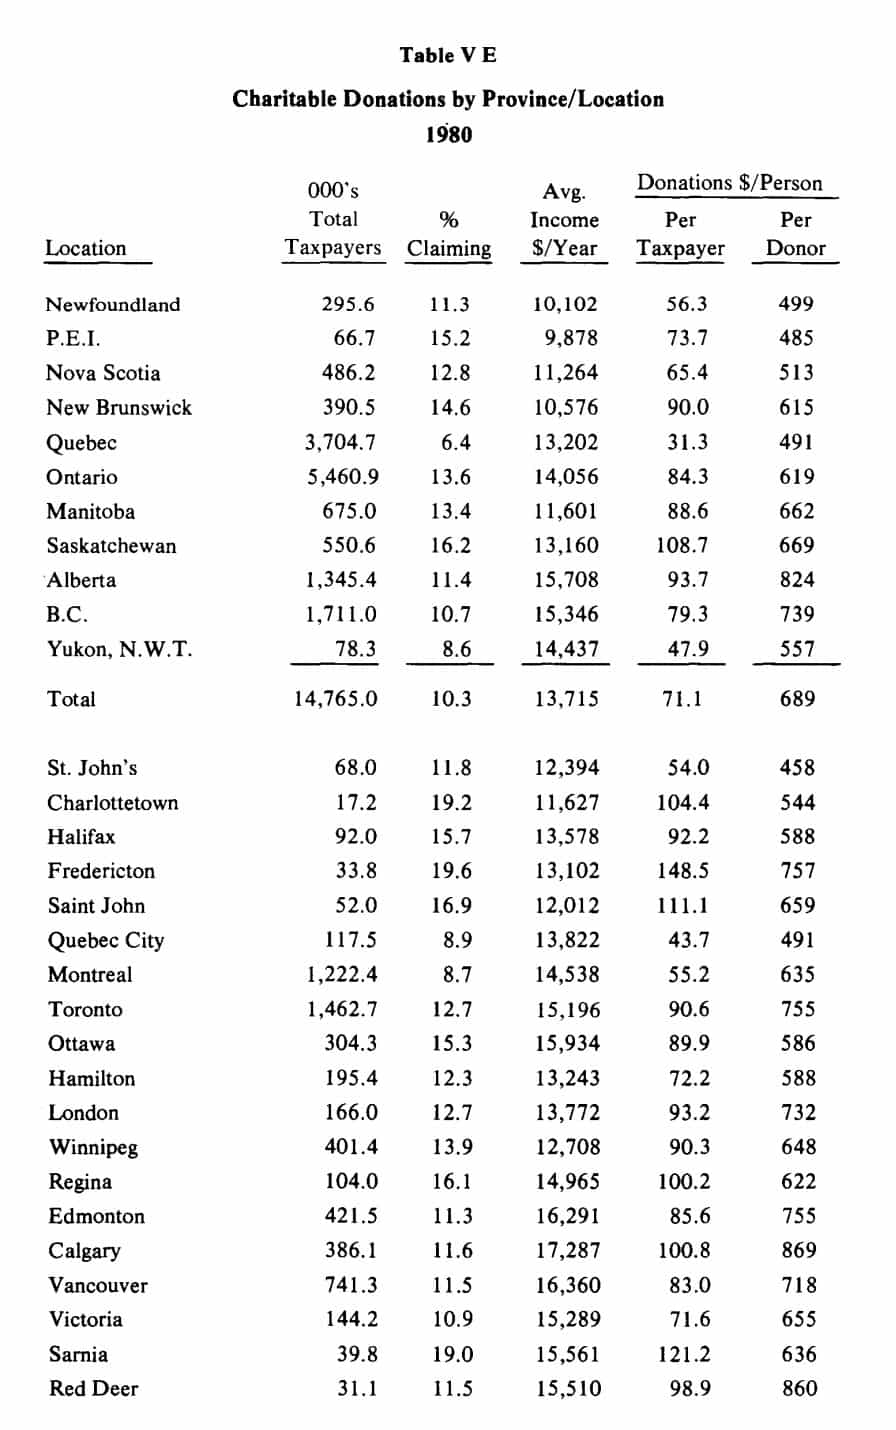
Tables VA through V E show comparisons of average personal income and average charitable donations by province and by selected cities for the years 1974, 1977, 1978, 1979 and 1980.
It is noticeable that the prairie provinces, especially Saskatchewan, are more generous than the maritime provinces and Quebec. While average income in Quebec and Saskatchewan in 1980 was about the same, in the first province only 6.4 per cent of the taxpayers claimed donations above $100. These claimants made an average contribution of$453 per donor. In Saskatchewan on the other hand, about 16.2 per cent of the taxpayers made charitable donations above $100. They averaged $669 per donor. The province with the highest per-donor donations was Alberta ($824 in 1980, $485 in 1974). The city with the highest perdonor donations in 1980 was Red Deer, Alberta ($860 per donor).
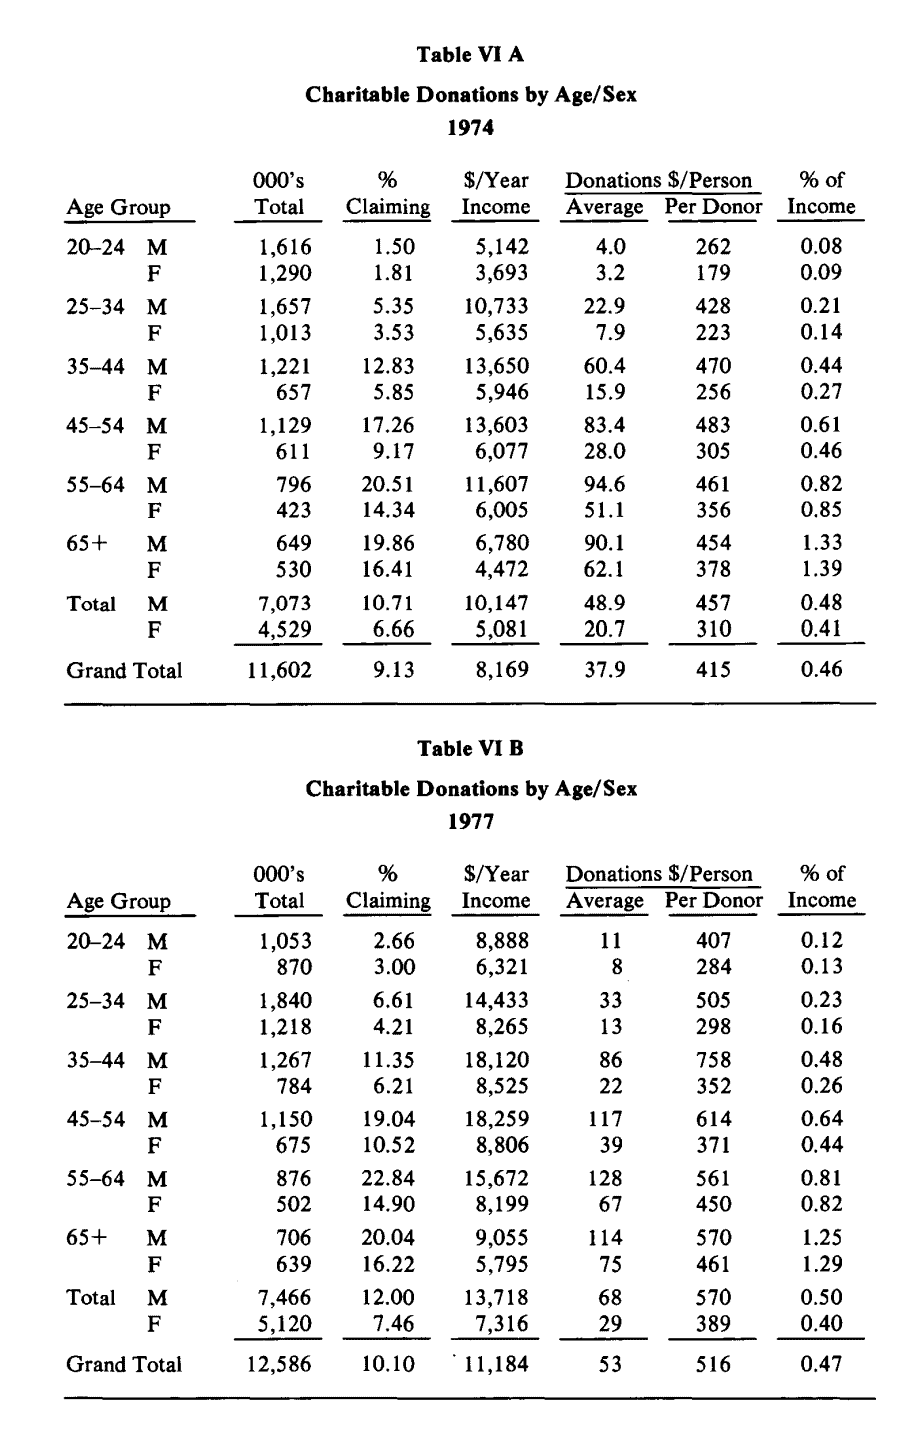
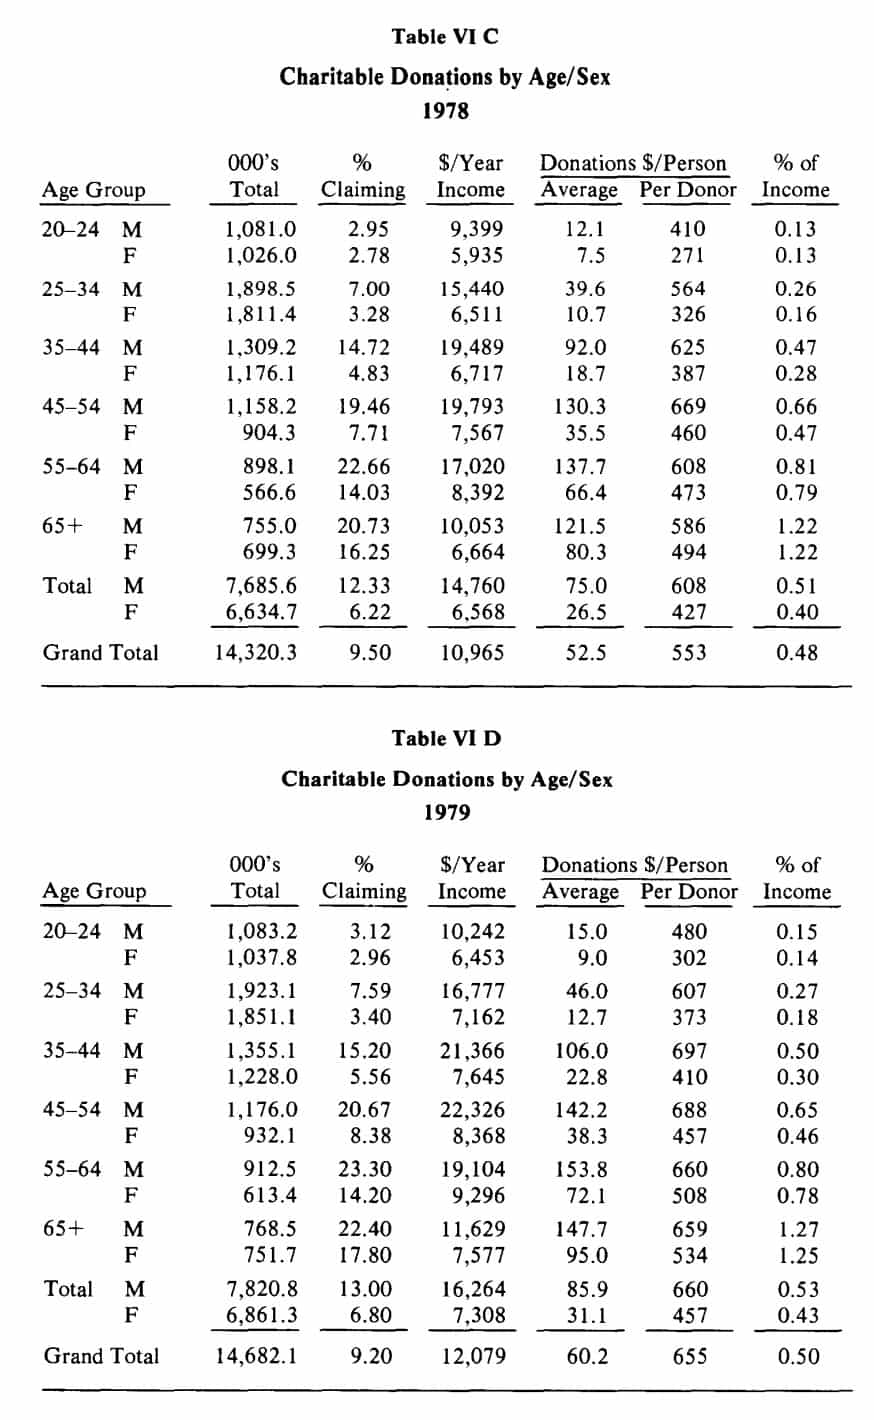
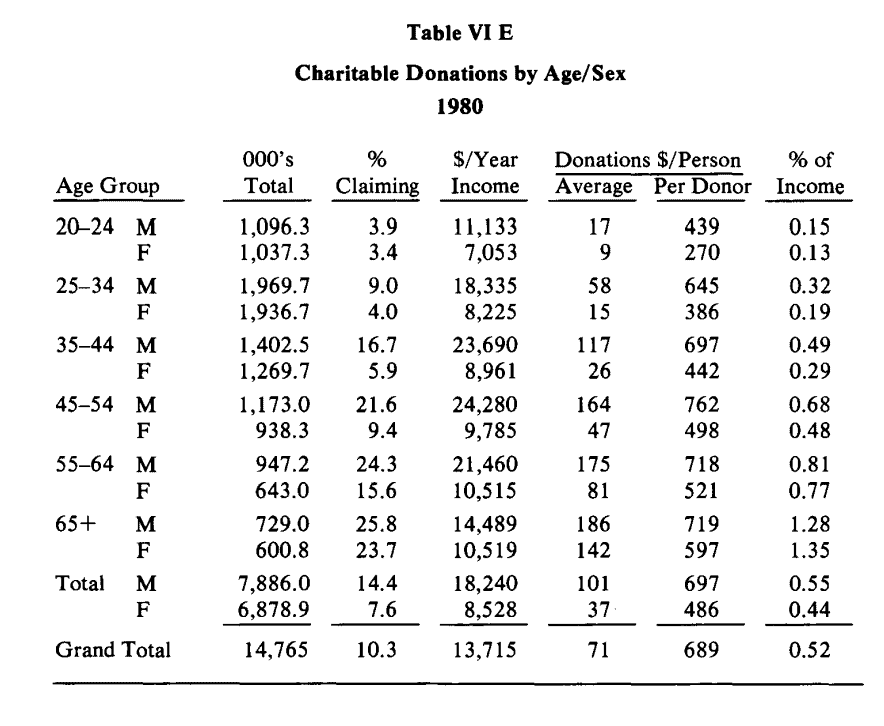
Analysis by Age and Sex
Tables VI A through VIE present comparisons between different age groups for both male and female taxpayers for the years 1974, 1977, 1978, 1979 and 1980. The conclusion here is that male income steadily rises with age up to age group 45-54, declining thereafter, probably because of increasing numbers of pensioners. Average income for males in 1980 increases from $11,133 per year for age group 20-24 to a high of$24,280 per year, for age group 45-54, declining to
$14,489 per year for age 65+. Female income in 1980 risesfrom$7 ,053 per year for age group 20-24 to $10,519 in the age group 65+. Charitable contributions made by male taxpayers run from $439 per donor to a high of $762 per donor, declining to $719 per donor for age 65+. The percentage of men donating runs from 3.9 for the 20-24 age group to ahighof25.8 in the age group 65+ (although income is declining at this age). Female taxpayers’ contributions start at $270 at lower ages and climb steadily to $597 at age 65+ (even though income here has declined markedly). Also the percentage of women claiming charitable donations, although lower than that for male claimants, increases steadily from a low of 3.4 at age 20-24 to a high of 23.7 for age 65+.
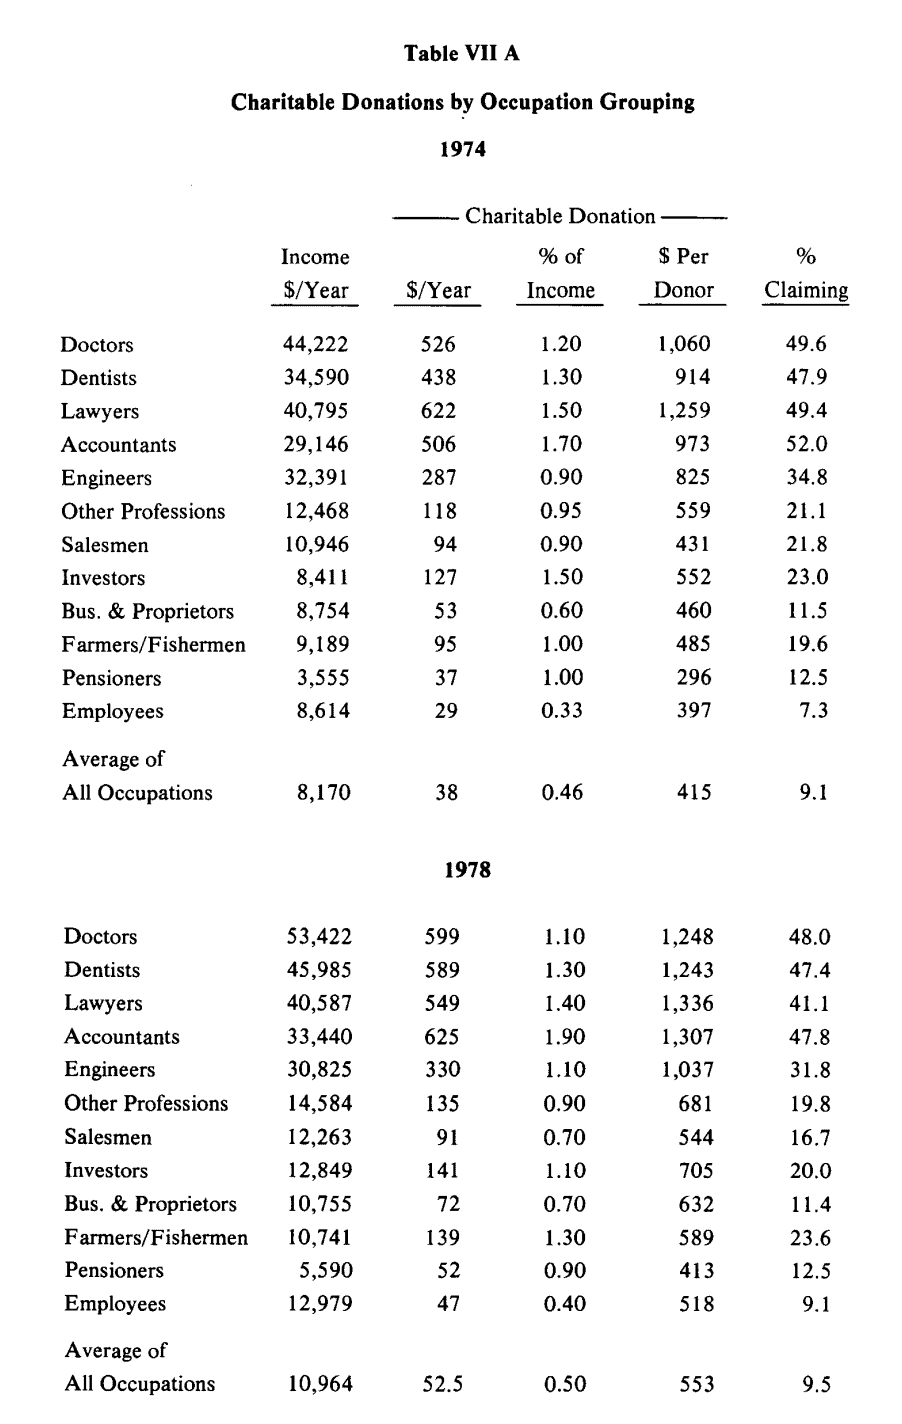
Analysis by Occupation
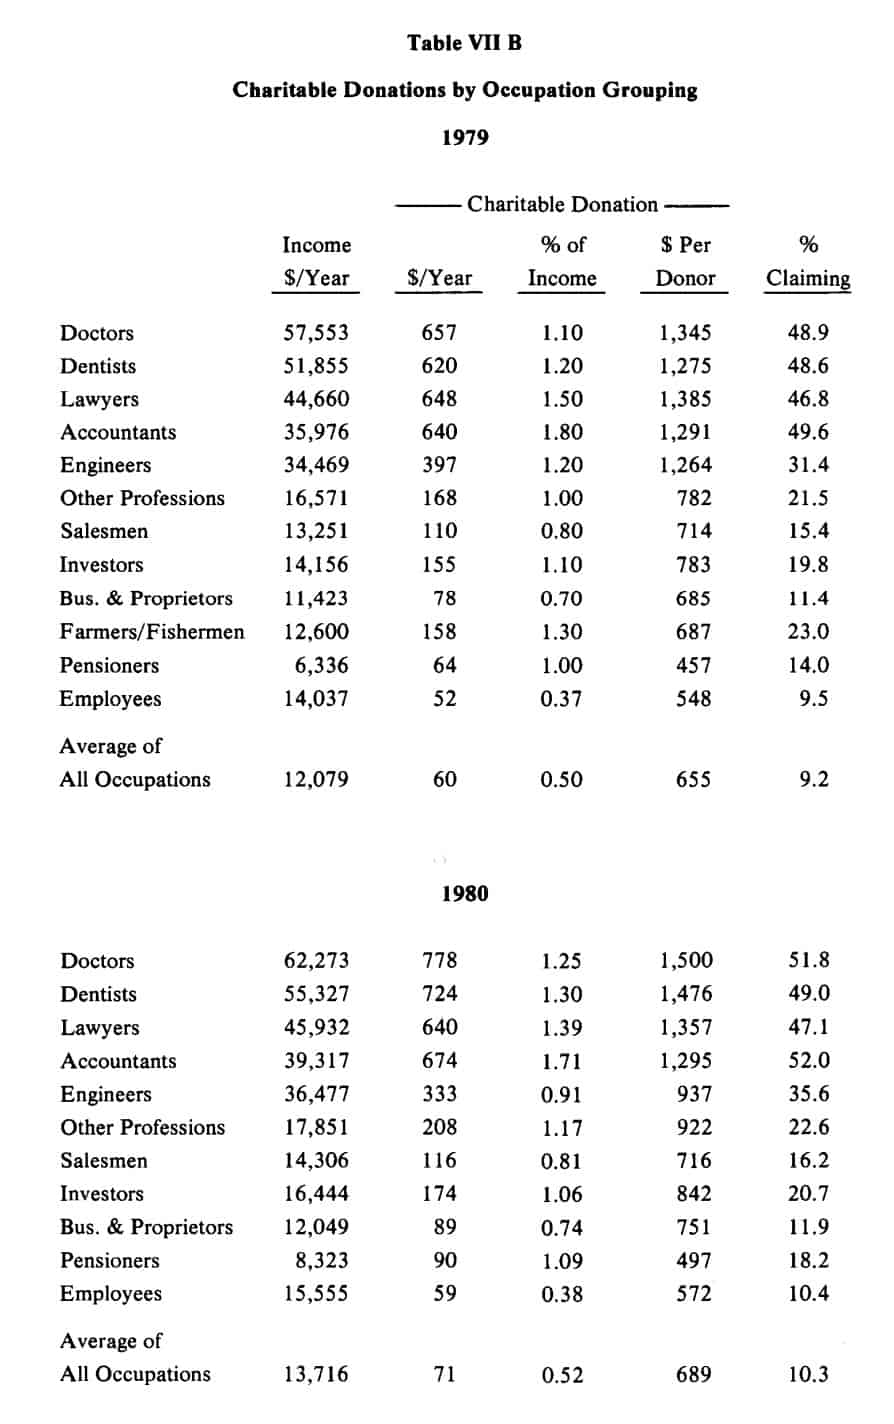
Tables VII A and VII B compare charitable donations by various occupational groups for the years 1974, 1978, 1979 and 1980.
As a group, accountants appear to be the most generous, with 52 percent giving at an average rate of 1.8 per cent of income. It is also remarkable that doctors and dentists, although the highest income earners, rank below lawyers and accountants in percentage of income given to charity.
Family Expenditure in Canada
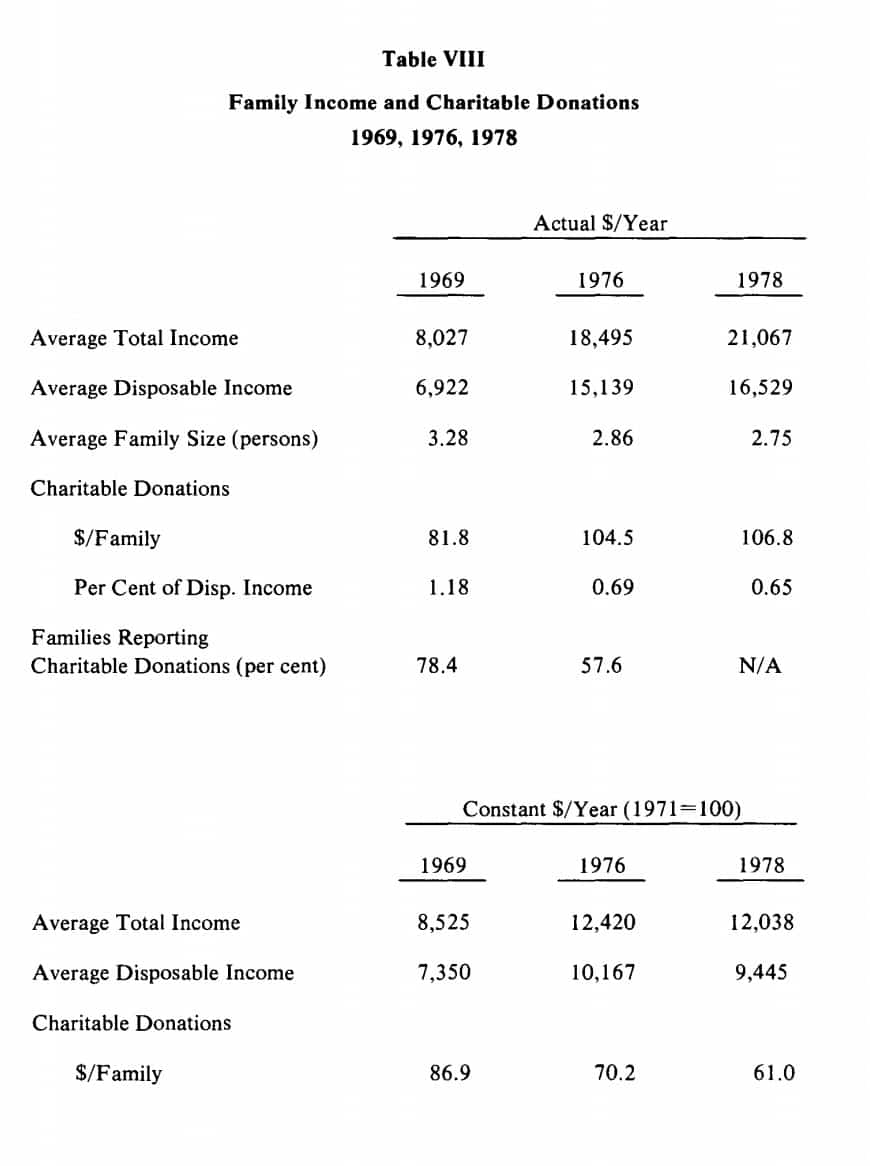
Another source for study of the spending habits of Canadians is the Family Expenditure Survey in Canada, published periodically by Statistics Canada. It reports data obtained by interviewing a random sample of families about their expenditures in detail. In 1969 this survey was based on a sample of 15,000 urban and rural families across Canada. The surveys of 1976 and 1978 (the latest available) covered only urban areas, i.e., eight major cities (St. John’s, Halifax, Montreal, Ottawa, Toronto, Winnipeg, Edmonton and Vancouver) and sampled 3,678 and 3,413 families, respectively. The diminishing trend of charitable donations over the years is further substantiated by the data derived from these surveys, summarized in Table VIII.
It is apparent that whereas between 1969 and 1976 average disposable family income more than doubled, charitable donations increased only 25 per cent. Also while income between 1976 and 1978 continued to rise, charitable donations remained practically the same.
When expressed in constant dollars ( 1971 = 100), the decline in charitable donations, both absolutely and relative to income, is also quite clear: $87 per family in 1969, $70 in 1976 and $60 in 1978.
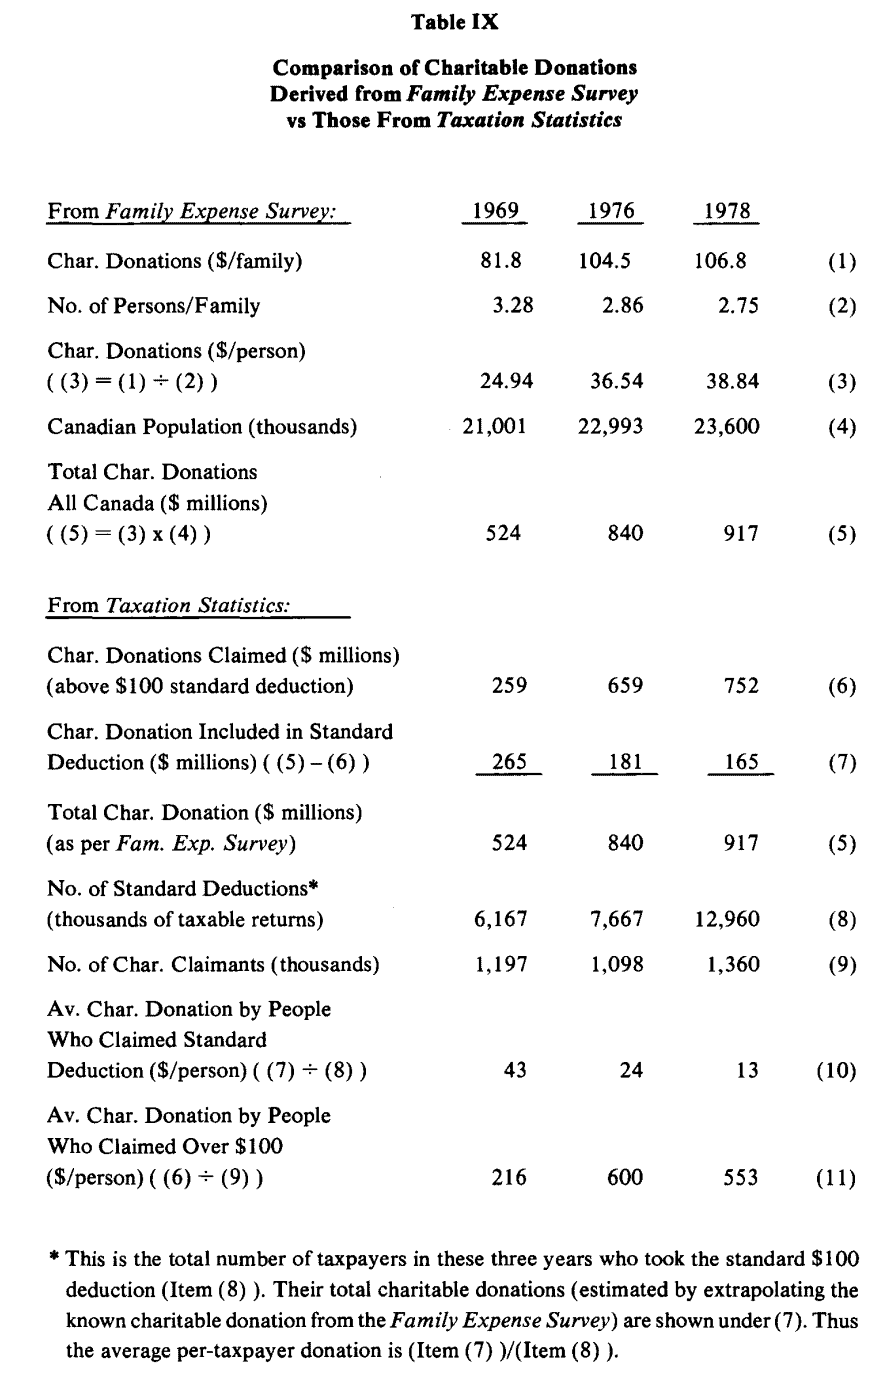
Table IX makes an estimate of the charitable donations made by people who claimed the standard deduction. This is done by extrapolating the charitable donations, stated in the Family Expenditure Survey for the average family, to the entire population of Canada. This gives us an estimate of total charitable donations, amounting to respectively $524 million, $840 million and $917 million for the years 1969, 1976 and 1978.
If we deduct from these the total claimed charitable donations, obtained from the Taxation Statistics Report for these years, we have an estimate of the charitable donations of people who claimed the standard deduction. The amounts were $43,
$24 and $13 per person for the years 1969, 1976 and 1978, respectively. Thus, we conclude that over the past nine years the majority oftaxpayers who claimed the standard deduction decreased their charitable donations by about 75 per cent. On the other hand, those who did claim charitable donations over $100 increased their contributions from $216/person in 1969 to $553/person in 1978.
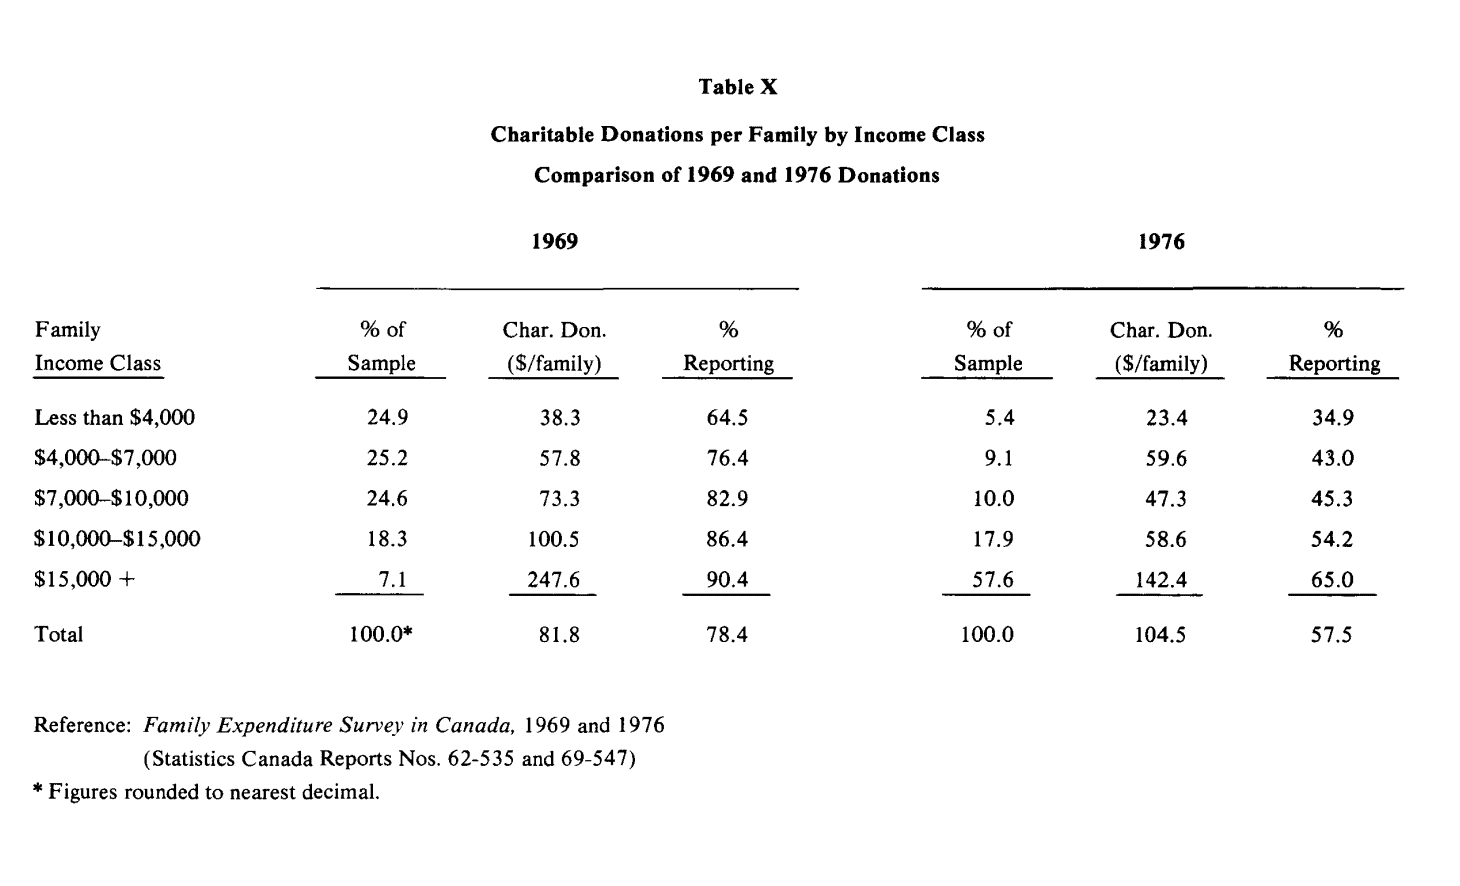
The Family Expense Surveys for 1969 and 1976, for which we have a complete analysis, confirm the downward trend in charitable giving as Table X indicates.


J.F. DEEG
Chairman, Statistical Studies,The Canadian Centre for Philanthropy